
- Title
-
Thermal Proteome Profiling in Zebrafish Reveals Effects of Napabucasin on Retinoic Acid Metabolism
- Authors
- Leijten, N.M., Bakker, P., Spaink, H.P., den Hertog, J., Lemeer, S.
- Source
- Full text @ Mol. Cell. Proteomics

|
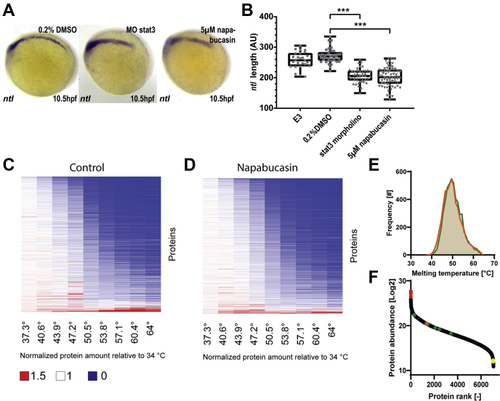
Thermal proteome profiling of Napabucasin in zebrafish embryos. Embryos were treated with napabucasin (5 μM) or solvent control (0.2% DMSO). Alternatively, antisense STAT3-specific morpholino (MO stat3) was microinjected at the 1-cell stage. A, at 10.5 hpf, the embryos were fixed, and in situ hybridization was performed using a ntl-specific probe, which stains the notochord. B, the length of the notochord was determined in napabucasin treated and stat3-morpholino knockdown embryos compared with DMSO and nontreated E3 medium control. Significance was determined using a one-way ANOVA with Dunnetts multiple comparisons test, n = 26 to 66 embryos per condition; ∗∗∗p < 0.001. The global precipitation behavior of proteins in DMSO (C) or napabucasin treated (D) lysate is similar, in agreement with overall comparable melting points for proteins under these two conditions (E). The protocol captured a large dynamic range of proteins, ranging from high abundant proteins such as Vtg1, Ttnb, and Myhz1.2 (red) to low abundant proteins such as Sirt1, Cbx5 and Bbs7 (yellow). Additionally, Stat3 (orange) and all shifting Aldh proteins (green) are shown (F). hpf, hours postfertilization. |

TPP indicates differential effects of napabucasin treatment on selected proteins. Stat33 (A) does not show any shift, whereas Stat5 (B) shows a small shift. However, a shift was detected in Aldh1a2 (C) and Aldh1a3 (D). The known interactor of napabucasin Nqo1 (E) shows no shift. Interestingly, another known interactor, Pora, (F) shows a shift indicating destabilization. Data points (n = 2 independent experiments) are shown as mean ± SEM, melting curve fitting was performed according to chemical denaturation theory. |

Activation and conservation of human ALDHs. The ALDH assay measures the conversion of NAD+ to NADH using a colorimetric probe (A). ALDH enzymatic activity was determined in lysates of HepG2 cells. Two concentrations of napabucasin were used (50 μM and 100 μM) as well as a known ALDH activator, ALDA-1 (20 μM). 1% DMSO was used as a control, and experiments were performed in triplicate. p∗∗∗ <0.001, p∗∗∗∗ <0.0001. Significance was determined by one-way ANOVA (B). The shifting (underlined) zebrafish aldh1a2, aldh1a3, and aldh2.1 show a large degree of conservation with their human counterparts (shown in italic and bold), but show no large conservation with other zebrafish or human Aldh enzymes (C). Aldhs, aldehyde dehydrogenases. |
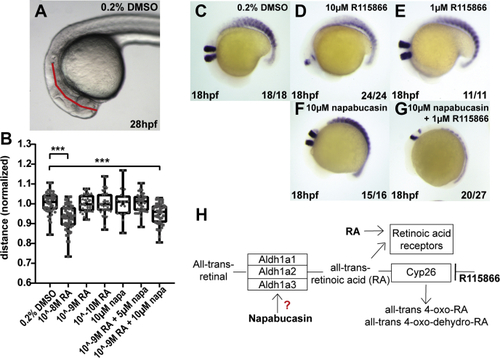
Validation of the off-targets of napabucasin using a zebrafish phenotypic model. The distance between the otolith and the tip of the nose was determined (indicated with a red line) in control (0.2% DMSO) RA treated (10−8, 10−9 or 10−10 M), napabucasin (10 μM) or combinations, as indicated (A–B). Significance was determined using a one-way ANOVA with Dunnetts multiple comparisons test. Individual dots represent individual embryos; minimally 26 and maximally 66 embryos were used per condition; ∗∗∗p < 0.001. Zebrafish embryos were treated with the Cyp26 inhibitor, R115866, with napabucasin or combinations. The embryos were fixed at 18 hpf, and in situ hybridization was performed using krox20 and myod-specific probes, marking rhombomeres (3 and 5) and the somites, respectively (C–G). Schematic representation of RA metabolism and the role of Aldhs and Cyp26 in the process (H). Aldhs, aldehyde dehydrogenases; hpf, hours postfertilization; RA, retinoic acid. |