
|
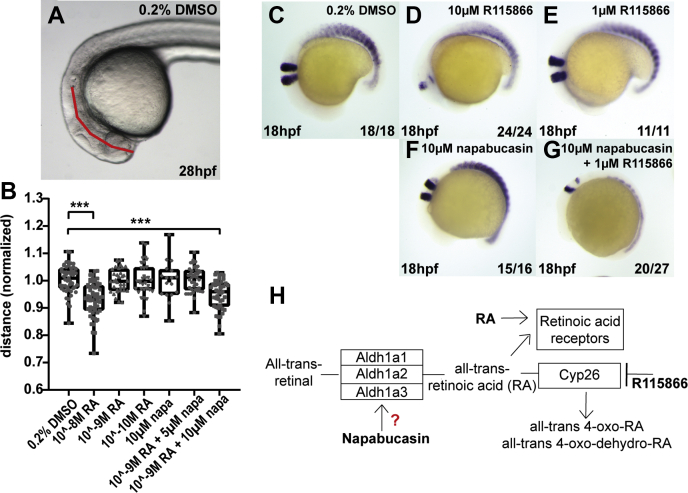
Fig. 5
Validation of the off-targets of napabucasin using a zebrafish phenotypic model. The distance between the otolith and the tip of the nose was determined (indicated with a red line) in control (0.2% DMSO) RA treated (10−8, 10−9 or 10−10 M), napabucasin (10 μM) or combinations, as indicated (A–B). Significance was determined using a one-way ANOVA with Dunnetts multiple comparisons test. Individual dots represent individual embryos; minimally 26 and maximally 66 embryos were used per condition; ∗∗∗p < 0.001. Zebrafish embryos were treated with the Cyp26 inhibitor, R115866, with napabucasin or combinations. The embryos were fixed at 18 hpf, and in situ hybridization was performed using krox20 and myod-specific probes, marking rhombomeres (3 and 5) and the somites, respectively (C–G). Schematic representation of RA metabolism and the role of Aldhs and Cyp26 in the process (H). Aldhs, aldehyde dehydrogenases; hpf, hours postfertilization; RA, retinoic acid.