FIGURE SUMMARY
Title

Hallmarks of primary neurulation are conserved in the zebrafish forebrain

Authors
Werner, J.M., Negesse, M.Y., Brooks, D.L., Caldwell, A.R., Johnson, J.M., Brewster, R.M.
Source
Full text @ Commun Biol

Neurulation in amniotes. Cross-sectional illustration of stages of neurulation in amniotes.

a The neural plate and adjacent non-neural ectoderm. b Medial hingepoint formation shapes the neural groove and elevates the neural folds. b1 Illustration of medial hingepoint cells that are apically constricted and enriched for actomyosin at their apex. c Dorso-lateral hingepoint formation brings the neural folds in close apposition. c1 Filopodial extensions establish contact between neural fold cells across the midline. In the mouse forebrain, the first contact is established between neuroectodermal cells. d The neural folds fuse medially, separating the epidermis from the neural tube. DLHP dorso-lateral hingepoint, MHP medial hingepoint, NF neural fold.

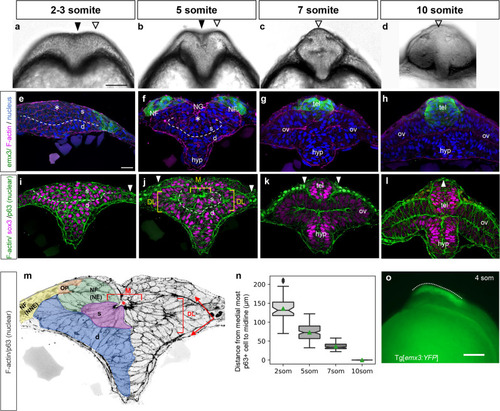
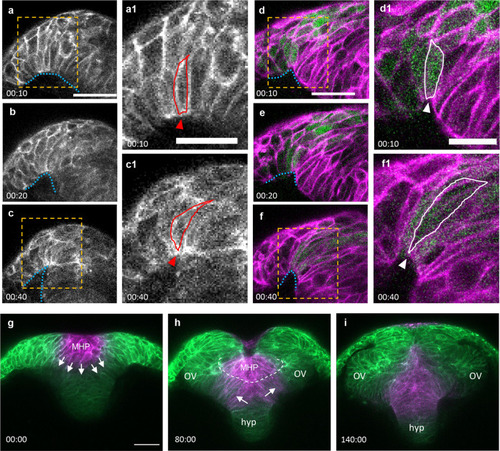
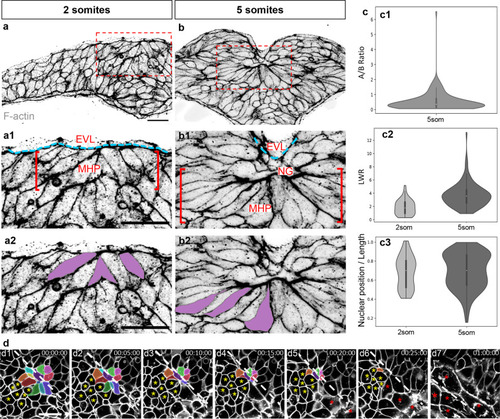
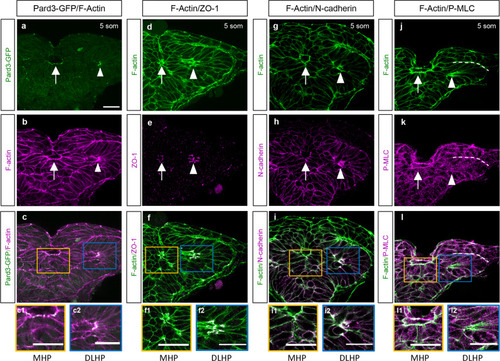
Hingepoints and neural folds contribute to forebrain morphogenesis.

ad Optical sections at the level of the forebrain of WT embryos at the 2–3 som (a), 5 som (b), 7 som (c), and 10 som (d) stages. el Transverse sections through the ANP of 2–3 som (e, i), 5 som (f, j), 7 som (g, k) and 10 som (h, l) embryos. eh Tg[emx3:YFP] embryos labeled with anti-GFP (green), phalloidin (F-actin, magenta), and DAPI (nuclei, blue). il WT embryos labeled with phalloidin (F-actin, green), anti-Sox3 (magenta), and anti-p63 (nuclear label, green). m Higher magnification image of j, gray scaled to reveal F-actin and p63 and pseudo-colored - color code: light blue: superficial eye field cells, dark blue: deep layer eye field cells that apically constrict to form the optic vesicles, green: neural component of the neural fold, orange: olfactory placode (Sox3/p63-negative cells), yellow: non-neural component of the neural fold. n Measurements of neural fold convergence, scored as the distance between the medial-most p63-positive cells on either side of the midline at different developmental stages. Notches depict the 95% confidence interval around the median and the green triangle depicts the distribution mean. 2 som: 48 measurements from 14 embryos, mean = 136; 5 som: 144 measurements from 16 embryos, mean = 73.0; 7 som: 87 measurements from 10 embryos, mean = 36.0; 10 som: p63 domain is fused, no measurements. Statistical analysis: Mann–Whitney U tests, two-sided; 2 som vs 5 som: P = 1.18e−21, AUC = 0.961; 2 som vs 7 som: P = 8.35e−22, AUC = 1.00; 5 som vs 7 som: P = 2.14e−31, AUC = 0.958. o Side view of a 4 som Tg[emx3:YFP] embryo. s superficial layer, d deep layer, NF neural fold, NG neural groove, hyp hypothalamus, tel telencephalon, ov optic vesicle, DL dorso-lateral hingepoints; M medial hingepoint, NE neural ectoderm, NG neural groove, NNE non-neural ectoderm, OP olfactory placode. Annotations: black arrowhead = median groove, white open arrowhead = elevated neural fold-like structure, dashed line = separation of the deep and superficial layers; brackets = hingepoints; dotted line = A-P range of the neural folds; white arrowhead = medial-most epidermis; red asterisk = neural groove. Scale bars: a and o = 100 μm, e = 25 μm.

Cell shape changes in the deep layer of the ANP that contribute to DLHP and neural fold formation.

ae Transverse section, at the level of the forebrain, of embryos at the 2–3 (a), 5 (b, b1, c, c1), 7 (d, d1), and 10 (e, e1) somite stages mosaically expressing mGFP (green) and labeled with the nuclear marker DAPI (blue). The inset in a is a higher magnification of dashed area in a. b1e1 Higher magnifications of regions delineated by dotted lines in be. Annotations: red dashed circle = basal constriction of NE component of neural fold; yellow circle = apical constriction of DLHP cell; arrows = NE component of neural fold; arrowheads = NNE component of neural folds; double dashed arrow = elongated deep cells of the optic vesicle, asterisks = dividing cells in the prospective telencephalon. Scale bars: 25 μm in a and b1.

Measurements of cell shape changes in the deep neuroectodermal layer and neural folds.

a-c Measurements of cell lengths (μM, Y axis) of mGFP-labeled cells at different positions relative to the ANP midline (μM, X axis). Measurements begin in the region fated to become the optic vesicles. df Measurements of the apico:basal surface ratio of mGFP-labeled cells at different positions relative to the ANP midline (μM, X axis). Measurements begin in the region fated to form the optic vesicles. The original scatter plot was fitted to a 3rd degree polynomial. Confidence intervals for the polynomial are 95% and were calculated with bootstrap sampling (n = 1000). 2 somites: n = 66 cells from three embryos, 5 somites: 77 cells from 3 embryos, 7 somites: 72 cells from 3 embryos. Color code: light blue = neuroectodermal cells of the deep layer of 2 som stage embryos that are not yet identifiable based on cellular morphology; red = cells that form the optic vesicles; purple = cells that form the neuroectodermal component of the neural folds.

Dynamics of neural fold formation and MHP intercalation.

af Time-lapse movie frames of the ANP, from a transverse view. ac Still frames of an embryo expressing membrane Kaede (mKaede). df Still frames of a Tg[emx3:YFP] embryo expressing membrane RFP (mRFP, pseudo labeled magenta) and YFP (green). Yellow boxes in a, c, d, and f identify magnified areas in a1, c1, d1, and f1. gi Still frames of an embryo expressing mKaede (green), in which the MHP cells have been photoconverted (magenta) to follow their fate. MHP medial hingepoint, OV optic vesicles, hyp hypothalamus. Annotations: blue dotted line: outlines the basal side of the neural folds; red and white lines identify individual neural fold cells; arrowhead: indicate narrowing surface in neural folds cells; arrows: show direction of intercalation of MHP cells into the eye field; dotted white line: separation of the superficial and deep layers. Scale bars: 50 μm in a, d and g; 25 μm in a1 and d1.

Apical constriction of MHP cells.

ab2 Transverse sections through the ANP at the 2 (a, a1, a2) and 5 (b, b1, b2) som stages labeled with phalloidin (shown in greyscale). a1b2 are higher magnifications of the boxed areas in a and b, revealing the organization of the medial ANP (a1, b1) and the shape of individual MHP cells pseudo-colored in purple (a2, b2). c Quantification of cell shape changes. Boxplot elements within the violin plots depict quartiles with the centerline depicting the median. c1 Measurements of apical:basal surface ratio at 5 som (n = 115 cells from four embryos, mean = 0.548). c2 Measurement of length-to-width (LWR) ratio at 2 som (n = 47 cells from 5 embryos, mean = 1.88) and 5 som (same cells as in c1, mean=3.70). A Mann–Whitney two-sided U Test revealed that the LWR increase between 2 som and 5 som is statistically significant (P = 7.80e−11, AUC = 0.176). c3 Relative position of nucleus at 2 and 5 som measured in the same cell populations (c2). Mean nuclear position/cell length (0.682 at 2 som vs 0.696 at 5 som) is not statistically significant using a Mann–Whitney U test (P = 0.419, AUC = 0.460). d Still frames of time-lapse movie of mGFP-labeled embryo imaged from a dorsal view. Individual MHP cells are pseudo-colored, a cluster of cells adjacent to the MHP is indicated with yellow asterisks and EVL cells are labeled with red asterisks. EVL enveloping layer, MHP medial hingepoint; NG neural groove. Annotations: white dashed line = midline, red brackets = MHP region, blue dashed lines = outlines EVL, yellow asterisks: cells adjacent to MHP, red asterisks: EVL cells. Scale bars: 25 μm in a, a1, and a2; 10 μm in d1.

Oscillatory constriction with decreasing amplitude reduces the apical surface of MHP cells.

a Measurements of medial, MHP cells. a1 Relative apical surface areas over time for individual MHP cells. a2 Median values of MHP relative apical surface areas over time, 95% confidence interval, n = 71. a3 Representative trace of relative apical surface area over time for an individual MHP cell. b Measurements of MHP-adjacent cells. b1 Relative apical surface areas over time for individual MHP-adjacent cells. b2 Median values of MHP-adjacent relative apical surface areas over time, 95% confidence interval. b3 Representative trace of relative apical surface area over time for an individual MHP-adjacent cell. c Distributions of the duration of oscillation between two expanded states for MHP cells (red, median of 45 s per oscillation) and MHP-adjacent cells (blue, median of 45 s per oscillation). No significant difference (two-sided Mann–Whitney U test, P = 0.293, AUC = 0.489, n = 758 MHP cell oscillations, n = 1,113 MHP-adjacent oscillations). d Distributions of the timing of apical constrictions or expansions for MHP cells (red) and MHP-adjacent cells (blue). There is no significant difference between the two groups for constriction time (two-sided Mann–Whitney U test: constrictions, P = 0.541, AUC = 0.510, n = 458 MHP cell constrictions, n = 640 MHP-adjacent constrictions) but there is a statistically significant difference for expansion time (P = 0.000832, AUC = 0.441, n = 367 MHP cell expansions, n = 596 MHP-adjacent expansions). The median time for individual expansions of MHP and MHP-adjacent cells is 15 and 30 s, respectively. All boxplot elements depict quartiles with the centerline depicting the median. e Still frames of time-lapse movie of mGFP-labeled cells shown in greyscale. The oscillatory behavior of one cell, outlined in red, is shown over time. Scale bar: 10 μm in e.

Dynamics of neural fold fusion.

a, a1a7 Time-lapse movie frames of an embryo expressing mosaic GFP, imaged from a dorsal view, showing the initiation of neural tube closure. Images are overlays of the green and brightfield channels. Inset in a1 shows a dorsal view of an emx3-labeled embryo. Insets in a4a6 outline the eye-shaped opening that forms between closure sites one C1 and two (C2). b Greyscale time-lapse movie frames of an mGFP-labeled embryo imaged from a dorsal view, revealing the final stages of neural fold fusion. Insets in the lower right corner of b1b4 are higher magnification views of boxed areas. C1, C2 closure sites one and two. Annotations: red asterisk: apex of the neural fold arc; red dotted line: synchronous and posteriorly-directed neural fold fusion anterior to closure point one; white double arrows: distance between the neural folds; white dotted oval: eye-shaped opening, the corners of which are defined by closure points one and two; white dotted line: embryonic midline; red arrows: filopodia extending across the midline; time-elapsed is shown at the bottom of each panel. Scale bars: 50 μm in a1, 100 μm in a1 inset, and 25 μm in b1.

Dynamics of anterior neurulation.

a Still frames of an embryo expressing mKaede, showing how the measurements in graphs bl were acquired, at a discrete time point. Neural groove was measured as the angle formed by the dorsal-most tissue; the optic vesicle angle was measured as the angle formed by the outline of the optic vesicle as it evaginates; the neural fold basal angle was measured as the angle formed by the basal surface of NF cells; the neural fold elevation was measured as the difference between the (elevated) position of the basal surface of NFs relative to its initial position at time zero (T0); the distance between the neural folds is the measure of the distance between the basal surface of NF cells. bg Graphs illustrating the dynamics of neural groove formation (left Y axis, blue line in b and e), optic vesicle angle (left Y axis, blue line in c and f) and neural fold basal angle (left Y axis, blue line in d and g) as compared with neural fold elevation (right Y axis, black line in bd) and distance between the neural folds (right Y axis, black line in eg) over time (X axis). hl Measurements indicated in a were converted into rates: (measurement frame 2−measurement frame 1)/time_step. Solid lines represent a fitted linear model for rate measurements of four embryos with the standard error as the shaded area. Scale bar in a = 50 μm.

Molecular characterization of the MHP.

al Transverse sections through the ANP at the 5 som stage. Embryos double-labeled with Pard3-GFP (green) and phalloidin (F-actin, magenta) (ac2); ZO-1 (magenta) and F-actin (green) (df2); N-cadherin (magenta) and F-actin (green) (gi2); and with anti-P-MLC (magenta) and F-actin (green) (jl2). c, f, i, l Magenta and green channel overlay. Insets show higher magnification images of the MHP (yellow boxes, c1, f1, i1, l1) and DLHP (blue box, c2, f2, i2, l2). Annotations: arrow = MHP; arrowhead = DLHP; dotted line in jl = interface between the neuroectoderm and non-neural ectodermlayers of the neural folds; MHP medial hingepoint, DLHP dorsolateral hingepoint. Scale bars: 25 μm.

Role of non-muscle myosin II in apical constriction and neural fold convergence.

ac2’ Transverse sections through the ANP of 5 somuntreated (aa2’), blebbistatin-treated (bb2’) and NMIIB MO-injected embryos (cc2’). Embryos were labeled with phalloidin (F-actin, green) and anti-P-MLC (magenta). d Length-width ratio distributions for DLHP and MHP cells from untreated, blebbistatin-treated, and NMIIB MO-injected embryos. DLHP measurements: untreated: n = 50 cells (five embryos), mean = 5.22; blebbistatin-treated: n = 58 cells (four embryos), mean = 3.70; NMIIB MO-injected: n = 38 cells (three embryos), mean = 3.74. MHP measurements: untreated: n = 115 cells (four embryos), mean = 3.70 (same data as in Fig. 6 c2); blebbistatin-treated: n = 35 cells (four embryos), mean = 1.70; NMIIB MO-injected: n = 24 cells (3 embryos), mean = 1.68. Two-sided Mann–Whitney U test: DLHP: untreated vs blebbistatin: P = 1.30e−6, AUC = 0.771; untreated vs NMIIB MO-injected: P = 2.14e−5, AUC = 0.766; blebbistatin vs NMIIB MO-injected: P = 0.325, AUC = 0.440; MHP: untreated vs blebbistatin: P = 3.55e−12, AUC = 0.889; untreated vs NMIIB MO-injected: P = 3.50e−8, AUC = 0.859; blebbistatin vs NMIIB MO-injected: P = 0.343, AUC = 0.574. e Apical-to-basal length ratios of DLHP cells for untreated, blebbistatin-treated, and NMIIB MO-injected embryos, same cells quantified as in d. Two-sided Mann–Whitney U test: untreated vs blebbistatin-treated P = 0.00665, AUC = 0.348; blebbistatin-treated vs NMIIB MO-injected: P = 0.00827, AUC = 0.660; untreated vs NMIIB MO-injected: P = 0.930, AUC = 0.494. f Dorsal views of 2, 5, and 7 som embryos untreated or blebbistatin-treated labeled via in situ hybridization using an emx3 riboprobe. g Boxplots showing the distribution of telencephalon widths (double red arrow in f) according to treatment group. Notches depict the 95% confidence interval around the median and green triangles depict distribution means. 2 som: untreated: n = 26, mean = 283.224; DMSO-treated: n = 26, mean = 297.727; blebbistatin-treated: n = 34, mean = 299.412. 5 som: Untreated: n = 33, mean = 154.688; DMSO: n = 30, mean = 161.747; blebbistatin-treated: n = 23, mean = 217.472. Two-sided Mann–Whitney U test: 5 somuntreated vs DMSO: P = 0.332, AUC = 0.428; 5 somuntreated vs blebbistatin-treated: P = 1.30e−7, AUC = 0.0817; 5 som DMSO-treated vs blebbistatin-treated: P = 3.50e−6, AUC = 0.125. 7 som: untreated: n = 28, mean = 90.444; DMSO-treated: n = 27, mean 84.855; blebbistatin-treated: n = 24, mean = 169.779. Two-sided Mann–Whitney U test: 7 somuntreated vs DMSO: P = 0.170, AUC = 0.608; 7 som untreated vs blebbistatin-treated: P = 2.06e−9, AUC = 0.0140; 7 som DMSO-treated vs blebbistatin-treated: P = 1.46e−9, AUC = 0.00435. Annotations: double white arrows = cell length in deep layer; open arrowhead = DLHP; asterisks = rounded neuroectodermal cells; red double arrow = posterior-most telencephalon width. Scale bars: 25  μm in a and a1; 100  μm in  f.

Acknowledgments
This image is the copyrighted work of the attributed author or publisher, and ZFIN has permission only to display this image to its users. Additional permissions should be obtained from the applicable author or publisher of the image. Full text @ Commun Biol