IMAGE

Fig. 4

ID
ZDB-IMAGE-210215-17
Source
Figures for Werner et al., 2021
Image
Figure Caption

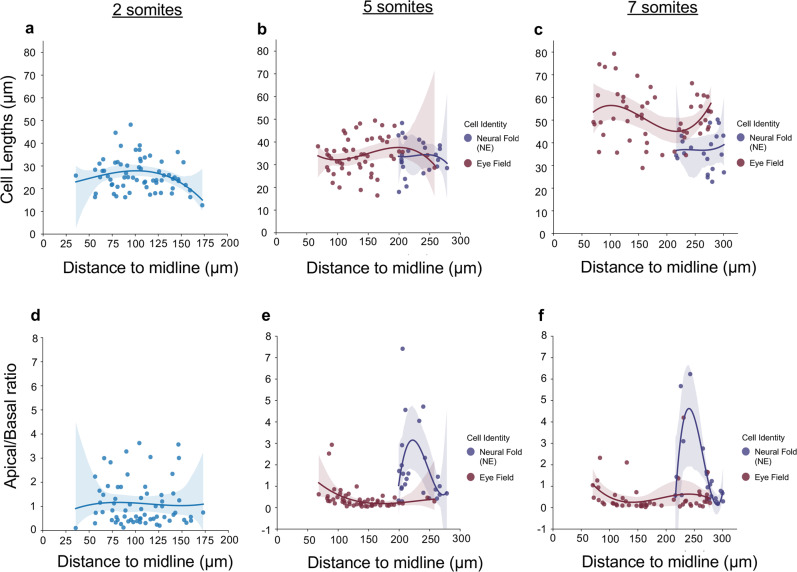
Fig. 4 Measurements of cell shape changes in the deep neuroectodermal layer and neural folds.

a-c Measurements of cell lengths (μM, Y axis) of mGFP-labeled cells at different positions relative to the ANP midline (μM, X axis). Measurements begin in the region fated to become the optic vesicles. df Measurements of the apico:basal surface ratio of mGFP-labeled cells at different positions relative to the ANP midline (μM, X axis). Measurements begin in the region fated to form the optic vesicles. The original scatter plot was fitted to a 3rd degree polynomial. Confidence intervals for the polynomial are 95% and were calculated with bootstrap sampling (n = 1000). 2 somites: n = 66 cells from three embryos, 5 somites: 77 cells from 3 embryos, 7 somites: 72 cells from 3 embryos. Color code: light blue = neuroectodermal cells of the deep layer of 2 som stage embryos that are not yet identifiable based on cellular morphology; red = cells that form the optic vesicles; purple = cells that form the neuroectodermal component of the neural folds.

Acknowledgments
This image is the copyrighted work of the attributed author or publisher, and ZFIN has permission only to display this image to its users. Additional permissions should be obtained from the applicable author or publisher of the image. Full text @ Commun Biol