IMAGE

Fig. 6

ID
ZDB-IMAGE-210215-19
Source
Figures for Werner et al., 2021
Image
Figure Caption

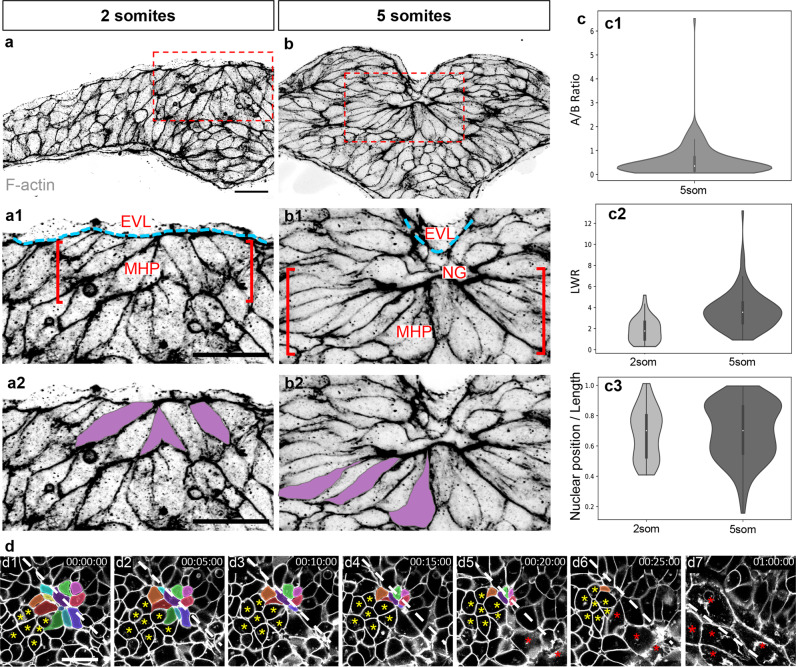
Fig. 6 Apical constriction of MHP cells.

ab2 Transverse sections through the ANP at the 2 (a, a1, a2) and 5 (b, b1, b2) som stages labeled with phalloidin (shown in greyscale). a1b2 are higher magnifications of the boxed areas in a and b, revealing the organization of the medial ANP (a1, b1) and the shape of individual MHP cells pseudo-colored in purple (a2, b2). c Quantification of cell shape changes. Boxplot elements within the violin plots depict quartiles with the centerline depicting the median. c1 Measurements of apical:basal surface ratio at 5 som (n = 115 cells from four embryos, mean = 0.548). c2 Measurement of length-to-width (LWR) ratio at 2 som (n = 47 cells from 5 embryos, mean = 1.88) and 5 som (same cells as in c1, mean=3.70). A Mann–Whitney two-sided U Test revealed that the LWR increase between 2 som and 5 som is statistically significant (P = 7.80e−11, AUC = 0.176). c3 Relative position of nucleus at 2 and 5 som measured in the same cell populations (c2). Mean nuclear position/cell length (0.682 at 2 som vs 0.696 at 5 som) is not statistically significant using a Mann–Whitney U test (P = 0.419, AUC = 0.460). d Still frames of time-lapse movie of mGFP-labeled embryo imaged from a dorsal view. Individual MHP cells are pseudo-colored, a cluster of cells adjacent to the MHP is indicated with yellow asterisks and EVL cells are labeled with red asterisks. EVL enveloping layer, MHP medial hingepoint; NG neural groove. Annotations: white dashed line = midline, red brackets = MHP region, blue dashed lines = outlines EVL, yellow asterisks: cells adjacent to MHP, red asterisks: EVL cells. Scale bars: 25 μm in a, a1, and a2; 10 μm in d1.

Acknowledgments
This image is the copyrighted work of the attributed author or publisher, and ZFIN has permission only to display this image to its users. Additional permissions should be obtained from the applicable author or publisher of the image. Full text @ Commun Biol