IMAGE

Fig. 11

ID
ZDB-IMAGE-210215-23
Source
Figures for Werner et al., 2021
Image
Figure Caption

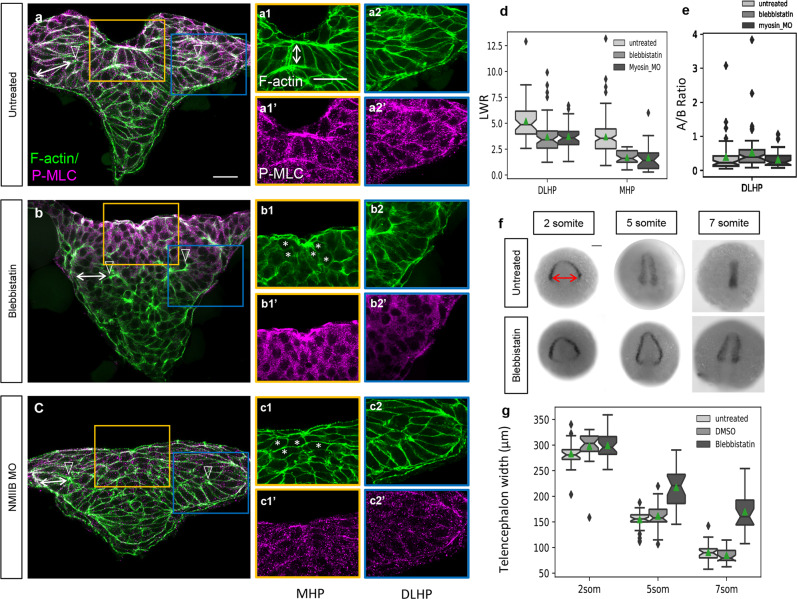
Fig. 11 Role of non-muscle myosin II in apical constriction and neural fold convergence.

ac2’ Transverse sections through the ANP of 5 somuntreated (aa2’), blebbistatin-treated (bb2’) and NMIIB MO-injected embryos (cc2’). Embryos were labeled with phalloidin (F-actin, green) and anti-P-MLC (magenta). d Length-width ratio distributions for DLHP and MHP cells from untreated, blebbistatin-treated, and NMIIB MO-injected embryos. DLHP measurements: untreated: n = 50 cells (five embryos), mean = 5.22; blebbistatin-treated: n = 58 cells (four embryos), mean = 3.70; NMIIB MO-injected: n = 38 cells (three embryos), mean = 3.74. MHP measurements: untreated: n = 115 cells (four embryos), mean = 3.70 (same data as in Fig. 6 c2); blebbistatin-treated: n = 35 cells (four embryos), mean = 1.70; NMIIB MO-injected: n = 24 cells (3 embryos), mean = 1.68. Two-sided Mann–Whitney U test: DLHP: untreated vs blebbistatin: P = 1.30e−6, AUC = 0.771; untreated vs NMIIB MO-injected: P = 2.14e−5, AUC = 0.766; blebbistatin vs NMIIB MO-injected: P = 0.325, AUC = 0.440; MHP: untreated vs blebbistatin: P = 3.55e−12, AUC = 0.889; untreated vs NMIIB MO-injected: P = 3.50e−8, AUC = 0.859; blebbistatin vs NMIIB MO-injected: P = 0.343, AUC = 0.574. e Apical-to-basal length ratios of DLHP cells for untreated, blebbistatin-treated, and NMIIB MO-injected embryos, same cells quantified as in d. Two-sided Mann–Whitney U test: untreated vs blebbistatin-treated P = 0.00665, AUC = 0.348; blebbistatin-treated vs NMIIB MO-injected: P = 0.00827, AUC = 0.660; untreated vs NMIIB MO-injected: P = 0.930, AUC = 0.494. f Dorsal views of 2, 5, and 7 som embryos untreated or blebbistatin-treated labeled via in situ hybridization using an emx3 riboprobe. g Boxplots showing the distribution of telencephalon widths (double red arrow in f) according to treatment group. Notches depict the 95% confidence interval around the median and green triangles depict distribution means. 2 som: untreated: n = 26, mean = 283.224; DMSO-treated: n = 26, mean = 297.727; blebbistatin-treated: n = 34, mean = 299.412. 5 som: Untreated: n = 33, mean = 154.688; DMSO: n = 30, mean = 161.747; blebbistatin-treated: n = 23, mean = 217.472. Two-sided Mann–Whitney U test: 5 somuntreated vs DMSO: P = 0.332, AUC = 0.428; 5 somuntreated vs blebbistatin-treated: P = 1.30e−7, AUC = 0.0817; 5 som DMSO-treated vs blebbistatin-treated: P = 3.50e−6, AUC = 0.125. 7 som: untreated: n = 28, mean = 90.444; DMSO-treated: n = 27, mean 84.855; blebbistatin-treated: n = 24, mean = 169.779. Two-sided Mann–Whitney U test: 7 somuntreated vs DMSO: P = 0.170, AUC = 0.608; 7 som untreated vs blebbistatin-treated: P = 2.06e−9, AUC = 0.0140; 7 som DMSO-treated vs blebbistatin-treated: P = 1.46e−9, AUC = 0.00435. Annotations: double white arrows = cell length in deep layer; open arrowhead = DLHP; asterisks = rounded neuroectodermal cells; red double arrow = posterior-most telencephalon width. Scale bars: 25  μm in a and a1; 100  μm in  f.

Acknowledgments
This image is the copyrighted work of the attributed author or publisher, and ZFIN has permission only to display this image to its users. Additional permissions should be obtained from the applicable author or publisher of the image. Full text @ Commun Biol