
- Title
-
A Model Construction of Starvation Induces Hepatic Steatosis and Transcriptome Analysis in Zebrafish Larvae
- Authors
- Xu, H., Jiang, Y., Miao, X.M., Tao, Y.X., Xie, L., Li, Y.
- Source
- Full text @ Biology (Basel)
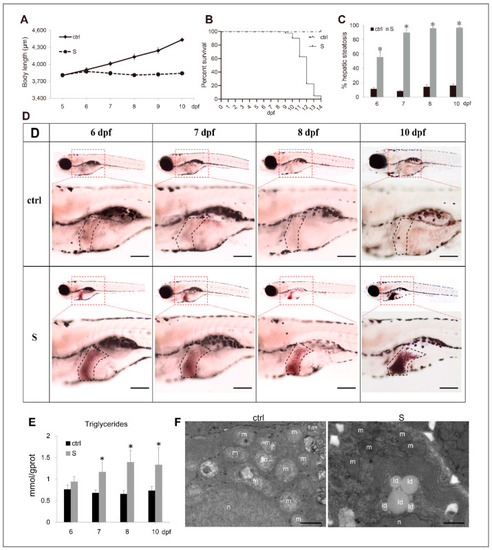
Characterization of starvation-induced hepatic steatosis in zebrafish larvae. (A) The depiction of growth performance in the control and starved larvae from 5 to 10 dpf. (B) The survival curve of the control and starved larvae was depicted by Kaplan-Meier assay. (C) Percentages of control and starved larvae with hepatic steatosis at 6, 7, 8, and 10 dpf. (D) Representative images of whole-mount Oil Red O (ORO) staining labelled the neutral lipids in larval liver at 6, 7, 8, and 10 dpf. The black dotted box labels the liver of zebrafish larvae. Bars = 200 μm. (E) Hepatic triacylglycerol (TAG) levels in the control and starved larvae from 6 to 10 dpf were determined. (F) Electron micrographs of hepatocytes from the control and starved larvae. Id: lipid droplets; m: mitochondria; n: cell nucleus. Bars = 10 μm. * indicates significant differences (p < 0.05). |
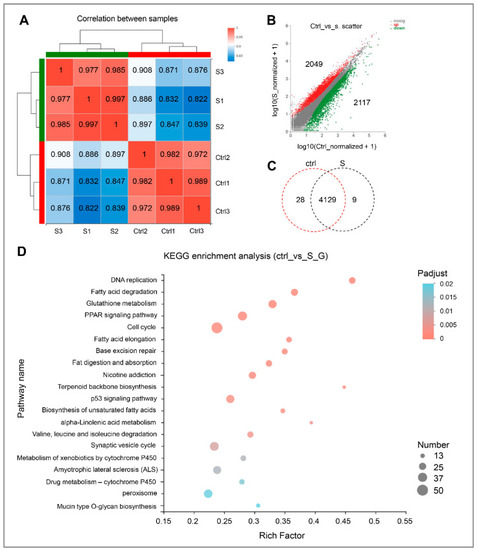
Gene expression and functional enrichment analysis of RNA-seq data. (A) Correlation analysis of intra-group and inter-group samples, respectively. (B) Scatter plot of differentially expressed genes in the control and starvation larvae. The red dots indicate up-regulated genes, and green dots indicate down-regulated genes. Ctrl represents the control group, that is, normal feeding larvae; S represents the starvation group. (C) Venn diagram analysis of differentially expressed genes in the control and starved larvae. (D) Scatter plot for KEGG enrichment analysis between control and starved larvae. The size and color of the circles represent the number of DEGs and the p-adjust value, respectively. |

Effect of starvation on the gene expression involved in the transmembrane transport of fatty acids in liver tissues. (A) Gene expression of solute carrier family 27 (fatty acid transporter), including slc27a1a, slc27a1b, slc27a2a, slc27a4, slc27a6, and slc27a6-like, were extracted in the control larvae from the RNA-seq data. (B) Differential expression of fatty acid transporter and fatty acid translocase (cd36) in the control and starved larvae. The FPKM (Fragments Per Kilobases Per Millionreads) value represents the mean ± SEM of three independent RNA-seq biological replicates. * indicates significant differences (p < 0.05). |
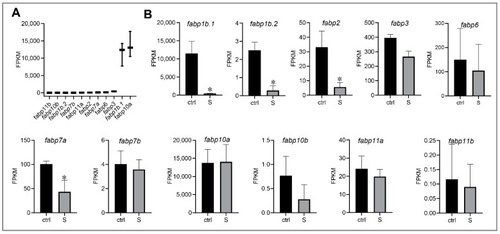
Effect of starvation on the gene expression involved in fatty acid binding proteins (FABPs) in liver tissues. (A) Gene expression of FABPs, including fabp1b.1, fabp1b.2, fabp2, fabp3, fabp6, fabp7a, fabp7b, fabp10a, fabp10b, fabp11a, and fabp11b, were extracted in the control larvae from RNA-seq data. (B) Differential expression of FABP genes in the control and starved larvae. The FPKM value represents the mean ± SEM of three independent RNA-seq biological replicates. * indicates significant differences (p < 0.05). |
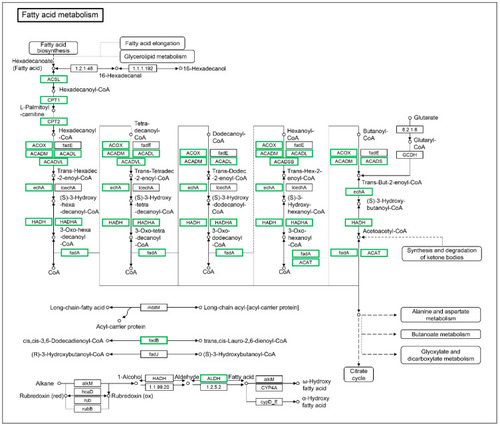
The differentially expressed genes identified by KEGG in the fatty acid metabolism pathway. The DEGs included BX890602.1, acsl3a, acsl4a, acsbg1, cpt1ab, cpt1b, cpt2, acox1, acox3, acadm, acadl, acadvl, acads, hadhaa, hadhab, hadh, hadhb, acaa1, acaa2, CABZ01065076.1, acat2, eci1, eci2, aldh3a2b, CAB Z01032488.1, and aldh9a1b. Green indicates down-regulated genes. |

Effect of starvation on the gene expression involved in lipogenesis in liver tissues. Differential expression of |

Effect of starvation on the gene expression involved in lipid transport in liver tissues. (A) Expression of apolipoprotein genes, including apoa1b, apoa2, apoa4b.1, apoea, apoc1, apoc2, apoeb, apoa4b.2, apobb.1, apom, apoa4a, apoba, apodb, apoa1a, apoc4, apooa, apoda.1, apoob, apof, apol1, apobb.2, and apool, were extracted in the control larvae from RNA-seq data. (B) Hepatic very low-density lipoprotein (VLDL) levels in the control and starved larvae at 8 dpf were determined. (C) Differential expression of the top 10 apolipoprotein genes in the control and starved larvae. The FPKM value represents the mean ± SEM of three independent RNA-seq biological replicates. * indicates significant differences (p < 0.05). PHENOTYPE:
|
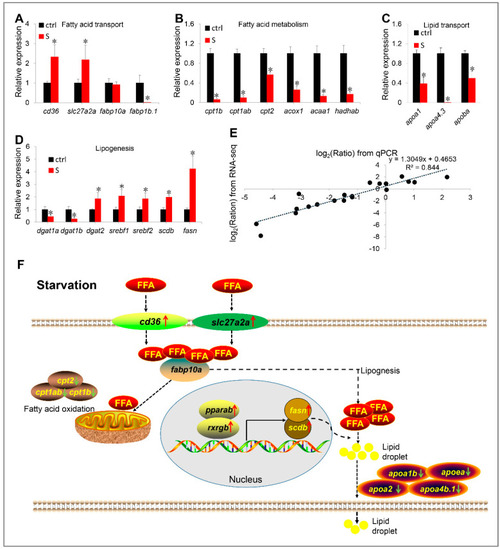
(A–E) Validation of RNA-seq data by qPCR. The mRNA levels of 20 genes involved in fatty acid transport (A), fatty acid metabolism (B), lipid transport (C), and lipogenesis (D) were measured by qPCR. (E) Correlation analysis of gene expression between RNA and qPCR. Scatter plot of gene expression in RNA-seq (y-axis) and qPCR (x-axis). “Ratio” in log2 (Ratio) represents the fold change with gene expression. * indicates significant differences (p < 0.05). (F) Schematic diagram of starvation triggering hepatic steatosis by regulating liver fatty acid intake, β oxidation, de novo lipogenesis and lipid transport. Starvation up-regulated transcription of slc27a2a, slc27a6-like, and cd36, promoting extrahepatic fatty acid uptake. In liver, starvation induces the expression of lipogenesis-related genes (srebf1, srebf2, fasn, and scdb) by activating the PPARα/RXR pathway, thereby promoting lipogenesis. Meanwhile, the fatty acid metabolism pathway was inhibited. Thus, most ingested extrahepatic fatty acids are used for lipogenesis rather than β oxidation. However, synthetic fat appears to be blocked in the liver, because starvation inhibits the expression of numerous apolipoprotein genes. Red arrows indicate up-regulated genes, green arrows indicate down-regulated genes. FFA: free fatty acid. EXPRESSION / LABELING:
|
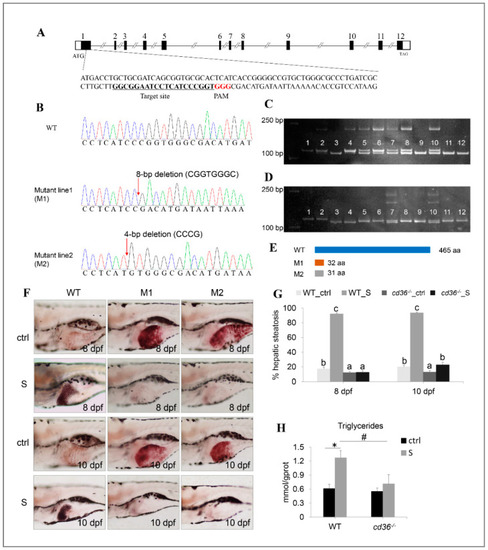
Establishment of the cd36 knockout zebrafish line. (A) Genomic structure of the zebrafish cd36 gene and CRISPR/Cas9 target site design. (B) DNA sequencing confirmed that two mutants (c. 86_93delCGGTGGGC, p.Pro29Argfs5) and (c. 84_87delCCCG, p. Ile28Metfs5) were generated. (C,D) Genotypes of cd36 mutants were screened by the PAGE technology. Image C labels the mutant line1 (M1): Lanes 3, 9, 11, and 12 were identified as cd36 homozygous mutant line; lanes 5, 6, 7, 8, and 10 were identified as cd36 heterozygous mutant line; lanes 1, 2, and 4 were identified as WT zebrafish. Image D labels the mutant line2 (M2): Lanes 3 and 4 were identified as cd36 homozygous mutant line; lanes 7 and 10 were identified as cd36 heterozygous mutant line; lanes 1, 2, 5, 6, 8, 9, 11, and 12 were identified as WT zebrafish. (E) A diagram representative of WT and two truncated mutant CD36 proteins (M1 and M2). (F) Oil Red staining of WT and cd36−/− mutant zebrafish larvae at 8 and 10 dpf. The ORO-stained signal in intestinal lumen is the lipid droplets of exogenous nutrients. (G) Percentages of WT and cd36−/− mutants (M1) with hepatic steatosis at 8 and 10 dpf. Significant differences are marked by different letters. (H) TAG levels in starved WT and cd36−/− mutants (M1) at 8 dpf. # p < 0.05 compared to WT_S; * p < 0.05 compared to WT_ctrl. PHENOTYPE:
|