
Figure 8
|
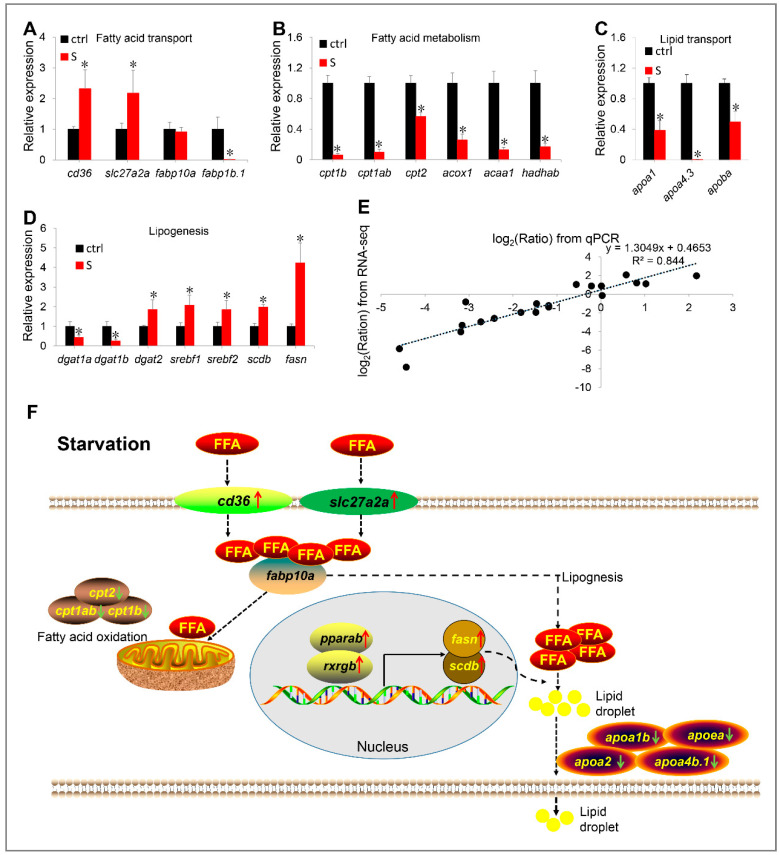
Figure 8 (A–E) Validation of RNA-seq data by qPCR. The mRNA levels of 20 genes involved in fatty acid transport (A), fatty acid metabolism (B), lipid transport (C), and lipogenesis (D) were measured by qPCR. (E) Correlation analysis of gene expression between RNA and qPCR. Scatter plot of gene expression in RNA-seq (y-axis) and qPCR (x-axis). “Ratio” in log2 (Ratio) represents the fold change with gene expression. * indicates significant differences (p < 0.05). (F) Schematic diagram of starvation triggering hepatic steatosis by regulating liver fatty acid intake, β oxidation, de novo lipogenesis and lipid transport. Starvation up-regulated transcription of slc27a2a, slc27a6-like, and cd36, promoting extrahepatic fatty acid uptake. In liver, starvation induces the expression of lipogenesis-related genes (srebf1, srebf2, fasn, and scdb) by activating the PPARα/RXR pathway, thereby promoting lipogenesis. Meanwhile, the fatty acid metabolism pathway was inhibited. Thus, most ingested extrahepatic fatty acids are used for lipogenesis rather than β oxidation. However, synthetic fat appears to be blocked in the liver, because starvation inhibits the expression of numerous apolipoprotein genes. Red arrows indicate up-regulated genes, green arrows indicate down-regulated genes. FFA: free fatty acid.