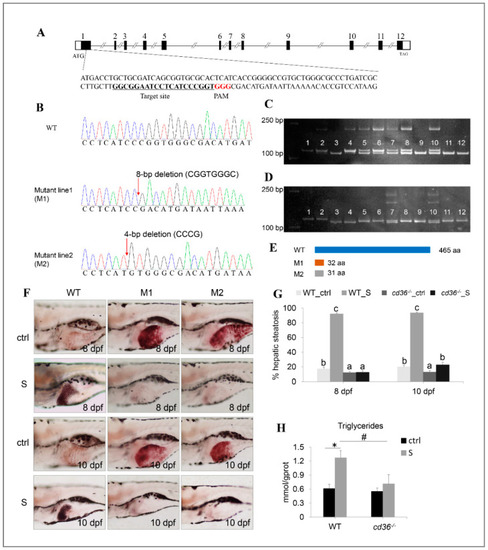
Establishment of the cd36 knockout zebrafish line. (A) Genomic structure of the zebrafish cd36 gene and CRISPR/Cas9 target site design. (B) DNA sequencing confirmed that two mutants (c. 86_93delCGGTGGGC, p.Pro29Argfs5) and (c. 84_87delCCCG, p. Ile28Metfs5) were generated. (C,D) Genotypes of cd36 mutants were screened by the PAGE technology. Image C labels the mutant line1 (M1): Lanes 3, 9, 11, and 12 were identified as cd36 homozygous mutant line; lanes 5, 6, 7, 8, and 10 were identified as cd36 heterozygous mutant line; lanes 1, 2, and 4 were identified as WT zebrafish. Image D labels the mutant line2 (M2): Lanes 3 and 4 were identified as cd36 homozygous mutant line; lanes 7 and 10 were identified as cd36 heterozygous mutant line; lanes 1, 2, 5, 6, 8, 9, 11, and 12 were identified as WT zebrafish. (E) A diagram representative of WT and two truncated mutant CD36 proteins (M1 and M2). (F) Oil Red staining of WT and cd36−/− mutant zebrafish larvae at 8 and 10 dpf. The ORO-stained signal in intestinal lumen is the lipid droplets of exogenous nutrients. (G) Percentages of WT and cd36−/− mutants (M1) with hepatic steatosis at 8 and 10 dpf. Significant differences are marked by different letters. (H) TAG levels in starved WT and cd36−/− mutants (M1) at 8 dpf. # p < 0.05 compared to WT_S; * p < 0.05 compared to WT_ctrl.
|
