
|
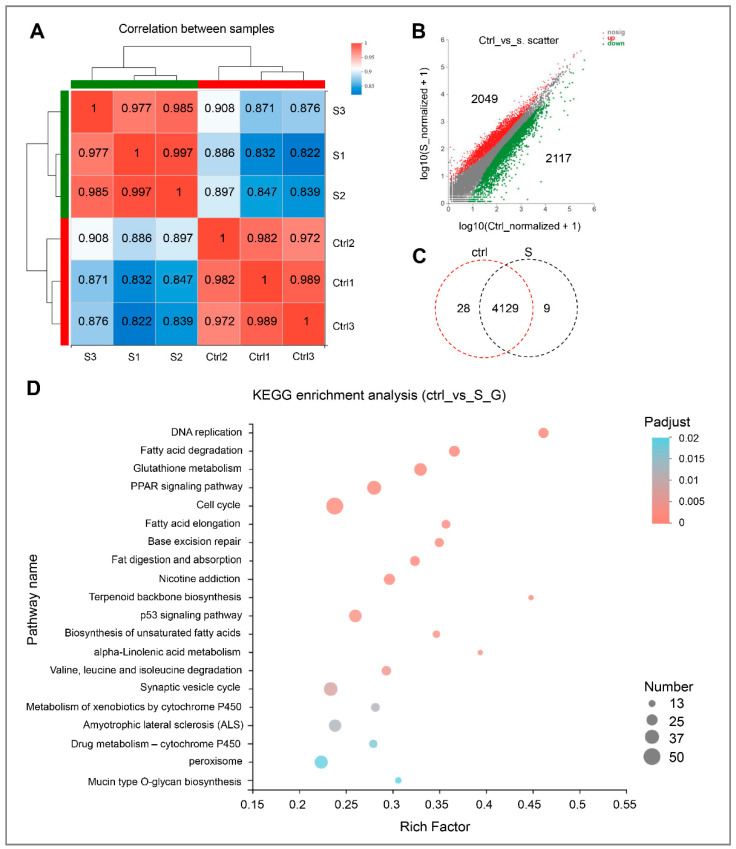
Figure 2 Gene expression and functional enrichment analysis of RNA-seq data. (A) Correlation analysis of intra-group and inter-group samples, respectively. (B) Scatter plot of differentially expressed genes in the control and starvation larvae. The red dots indicate up-regulated genes, and green dots indicate down-regulated genes. Ctrl represents the control group, that is, normal feeding larvae; S represents the starvation group. (C) Venn diagram analysis of differentially expressed genes in the control and starved larvae. (D) Scatter plot for KEGG enrichment analysis between control and starved larvae. The size and color of the circles represent the number of DEGs and the p-adjust value, respectively.