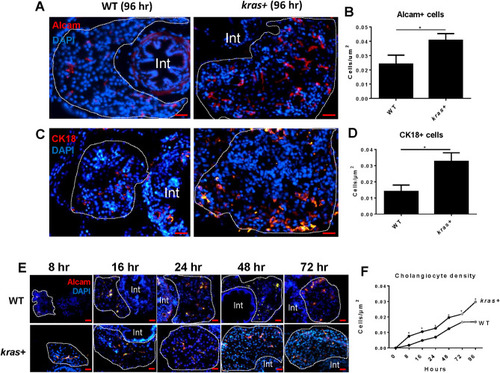
Increase of cholangiocytes upon induction of oncogenic krasV12 expression in hepatocytes of kras+ transgenic zebrafish larvae. Cholangiocytes were determined by using two different molecular markers: Alcam and Cytokeratin 18 (CK18). 3-dpf kras+ and WT zebrafish larvae were treated with 20 µg/ml Dox till 7 dpf. Samples were collected at different time points after Dox induction for immunohistochemistry. All liver sections were counter stained with DAPI. (AD) Representative images of Alcam antibody (A) and Cytokeratin 18 (Ck18) (C) and quantification of cholangiocyte density (B,D) in kras + and WT larvae at 96 h following Dox induction. (E,F) Time course of increase of cholangiocytes from 8 to 96 h following Dox induction. Representative images of Alcam staining of kras+ and WT larvae from 8 to 72 h are shown in (E) and 96 h in (A). Quantification of cholangiocyte density in kras+ and WT larvae is shown in (F). N = 10 at each time point. Scale bar: 20 μm. Statistical significance: *P˂0.05.

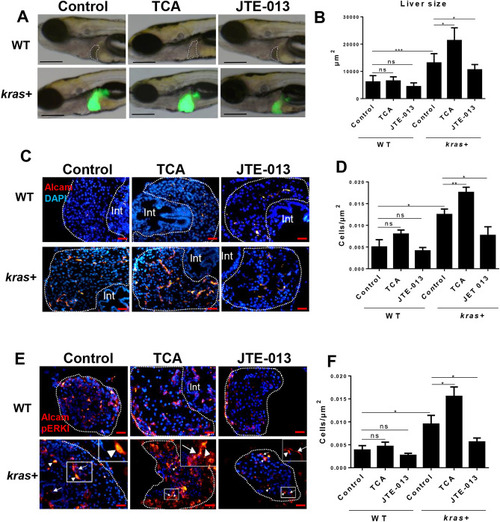
Effect of S1pr2 activation and inhibition on liver size, cholangiocyte density, and downstream marker pERK in kras+ and WT zebrafish larvae. 3-dpf kras+ and WT zebrafish larvae were treated with either TCA or JTE-013 along with 20 µg/mL Dox till 8 dpf. Samples were collected for immunohistochemistry and all liver sections were counter-stained with DAPI. (A) Representative images for liver size after treatment with TCA or JTE-013 in kras+ and WT zebrafish. Livers were recognized by GFP fluorescence in kras+ larvae and outlined in WT larvae. (B) 2D measurements of liver size in different groups. (C) Representative images of liver sections stained for Alcam in different groups. (D) Quantification of Alcam stained cholangiocytes. (E) Co-immunostaining of Alcam and pERK. Alexa Fluor 546 secondary antibody staining was used for Alcam and pERK detection. pERK stained signal is nucleus-localized as exampled in insets and indicated by arrowheads while Alcam staining is more on cell membrane as exampled and indicated by arrows in insets. (F). Quantification of pERK stained cholangiocytes. N = 10 each group. Scale bar: 200 μm (A) and 20 μm (C,E): Statistical significance: *P˂0.05.

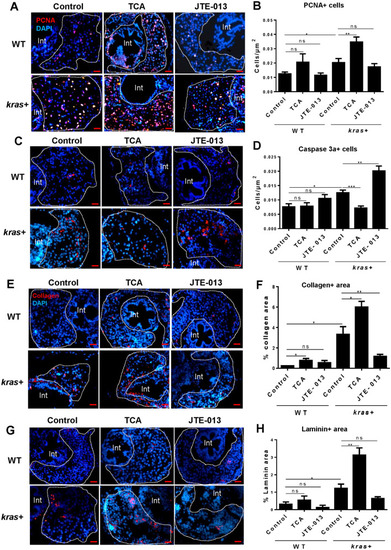
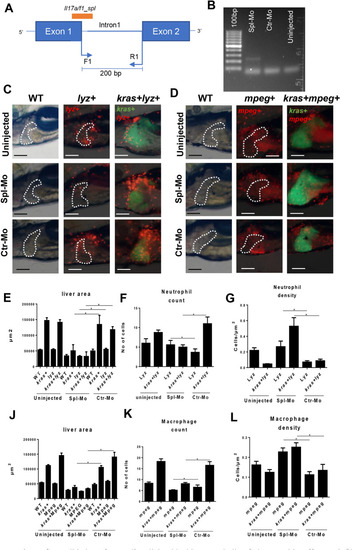
Effect of cholangiocyte activation and inhibition on hepatocyte proliferation, apoptosis and fibrosis. 3-dpf kras + and WT zebrafish larvae were treated with either TCA or JTE-013 along with 20 µg/mL Dox till 8 dpf. Samples were collected for immunohistochemistry. kras+ and WT liver sections were incubated with primary antibodies for PCNA, Caspase 3a, Collagen or Laminin and then stained with Alexa Fluor 546 conjugated secondary antibody. All liver sections were counter-stained with DAPI. (A,C, E,G) Representative images of staining for PCNA (A), Caspase 3a (C), Collagen (E) and Laminin (G) of kras+ and WT zebrafish larvae in different groups. (B,D, F,H) Quantification of staining signals. For PCNA and Caspase 3a staining, number of stained cells were quantified. For Collagen and Laminin stainings, stained areas were quantified. N = 10 each group. Scale bar: 20 μm. Statistical significance: *P˂0.05.

Effects of differential feeding on liver tumorigenesis. 7-dpf kras+ and WT zebrafish larvae were divided into four groups: control group (normal diet), starvation group (no diet), cholesterol group (10% cholesterol supplement) and glucose group (10% glucose supplement). These larvae were fed in these different regimes till 12 dpf, 20 µg/mL Dox treatment was applied to all groups till 12 dpf for various analyses. (A) Representative images of kras+ and WT larvae (12 dpf) to shows liver size in different feeding groups. Livers were recognized by GFP fluorescence in kras+ larvae and outlined in WT larvae. (B) 2D measurements of liver size in different groups. (C) Representative images of Oil red O staining of the kras+ and WT larvae in different feeding groups. (D) Quantification of Oil red O staining intensity in different groups. Examples of “Strong”, “Weak” and “None” staining are shown on the right of the histogram. (E) Fold change of s1pr2 mRNA expression in kras+ larvae over that of WT larvae in the same feeding regime. (F) Concentrations of total bile acid concentration in zebrafish larvae under different feeding conditions. Total bile acids were determined as µmol/L at 12 dpf. (GJ) Representative images of Alcam (G) and PCNA (I) staining and their quantification (H,J) in different feeding groups. N = 10 per group. Scale bar: 200 μm (A,C) and 20 μm (G,I). Statistical significance: *P˂0.05.

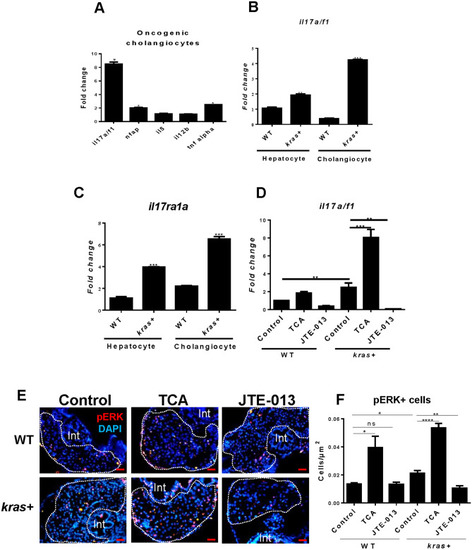
Expression of selected cytokine mRNAs in hepatocytes and cholangiocytes of the liver in adult zebrafish. (A) Expression of selected cytokine mRNAs in cholangiocytes upon kras induction in hepatocytes. (B, C) Expression of il17a/f1 (B) and il17ra1a mRNAs in cholangiocytes and hepatocytes in WT and kras+ larvae following Dox induction from 3 to 8 dpf. (D) Expression of il17a/f1 mRNA in kras + and WT larvae treated with TCA and JTE-013 together with Dox from 3 to 8 dpf. In (A), gene expression values in the kras groups were normalized to their WT counterparts. In (BD), all values were normalized to WT hepatocyte value. (E, F) Representative images of il17a/f1 downstream maker p-ERK staining (E) and quantification of pERK stained cells (F) in kras+ and WT zebrafish larvae treated with TCA and JTE-013 from 3 to 8 dpf. N = 10 per group. Scale bars, 20 μm Statistical significance: *P˂0.05.

Validation of iL17a/f1 splicing blocking morpholino Spl-Mo and its effect on infiltration of neutrophils and macrophages in the liver. (A) Diagram of iL17a/f1 gene for the targeted sites of Spl-Mo and PCR primers. A 200-bp fragment is expected when Spl-Mo blocks the splicing. (B) Agarose gel electrophoresis of RT-PCR products after introduction of Spl-Mo. Mopholinos were introduced into zebrafish embryos at one cell stage and RNA was isolated at 6 hpf for RT-PCR analysis. (C, D) Representative images of liver-infiltrated neutrophils (C) and macrophages (D) after il17a/f1 knockdown by Spl-Mo. Lyz+ and mpeg+ transgenic zebrafish were used for marking neutrophils (dsRed expression) and macrophages (mCherry expression) respectively and these transgenic fish were compounded with kras+ zebrafish for investigation of liver-infiltrated immune cells. Livers are outlined for non-kras+ samples. (EG) Quantification of liver size (E), number (F) and density (G) of liver-infiltrated neutrophils. (JL) Quantification of liver size (J), number (K) and density (L) of liver-infiltrated macrophages. N = 10 per group. Scale bars: 100 μm. Statistical significance: *P˂0.05.

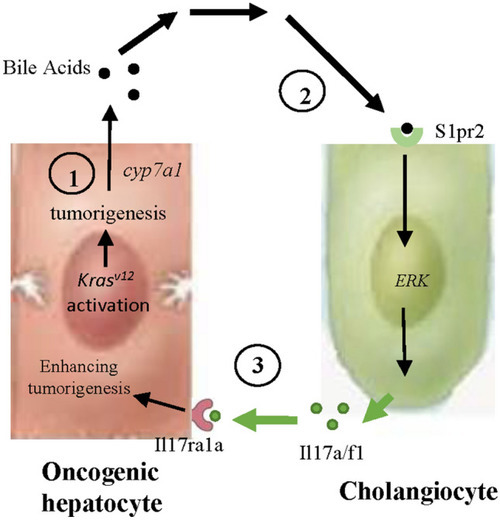
Proposed model for interaction between oncogenic hepatocytes and cholangiocytes in the kras + transgenic zebrafish model. First, oncogenic hepatocytes after krasv12 activation promote accumulation of triglycerides and elevate secretion of bile acids. Second, bile acids induce cholangiocyte proliferation through S1pr2, which, upon activation, induces pERK and secretion of Il17a/f1 cytokine. Third, Il17a/f1 binds to its receptor Il17ra1a on hepatocytes and promotes tumorigenesis through an inflammation pathway.

Acknowledgments
This image is the copyrighted work of the attributed author or publisher, and ZFIN has permission only to display this image to its users. Additional permissions should be obtained from the applicable author or publisher of the image. Full text @ Sci. Rep.