IMAGE

Figure 2

ID
ZDB-IMAGE-210123-13
Antibodies
Source
Figures for Helal et al., 2021
Image
Figure Caption

Figure 2

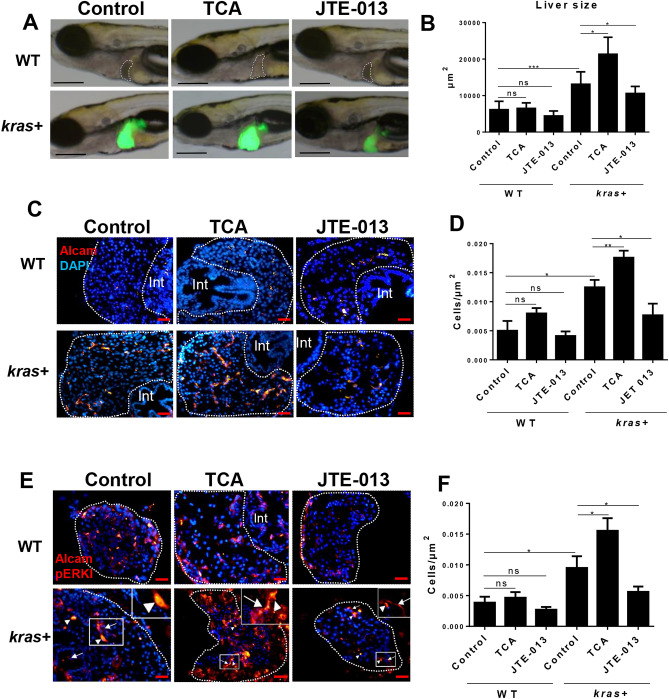
Effect of S1pr2 activation and inhibition on liver size, cholangiocyte density, and downstream marker pERK in kras+ and WT zebrafish larvae. 3-dpf kras+ and WT zebrafish larvae were treated with either TCA or JTE-013 along with 20 µg/mL Dox till 8 dpf. Samples were collected for immunohistochemistry and all liver sections were counter-stained with DAPI. (A) Representative images for liver size after treatment with TCA or JTE-013 in kras+ and WT zebrafish. Livers were recognized by GFP fluorescence in kras+ larvae and outlined in WT larvae. (B) 2D measurements of liver size in different groups. (C) Representative images of liver sections stained for Alcam in different groups. (D) Quantification of Alcam stained cholangiocytes. (E) Co-immunostaining of Alcam and pERK. Alexa Fluor 546 secondary antibody staining was used for Alcam and pERK detection. pERK stained signal is nucleus-localized as exampled in insets and indicated by arrowheads while Alcam staining is more on cell membrane as exampled and indicated by arrows in insets. (F). Quantification of pERK stained cholangiocytes. N = 10 each group. Scale bar: 200 μm (A) and 20 μm (C,E): Statistical significance: *P˂0.05.

Figure Data
Acknowledgments
This image is the copyrighted work of the attributed author or publisher, and ZFIN has permission only to display this image to its users. Additional permissions should be obtained from the applicable author or publisher of the image. Full text @ Sci. Rep.