IMAGE

Figure 5

ID
ZDB-IMAGE-210123-16
Genes
Source
Figures for Helal et al., 2021
Image
Figure Caption

Figure 5

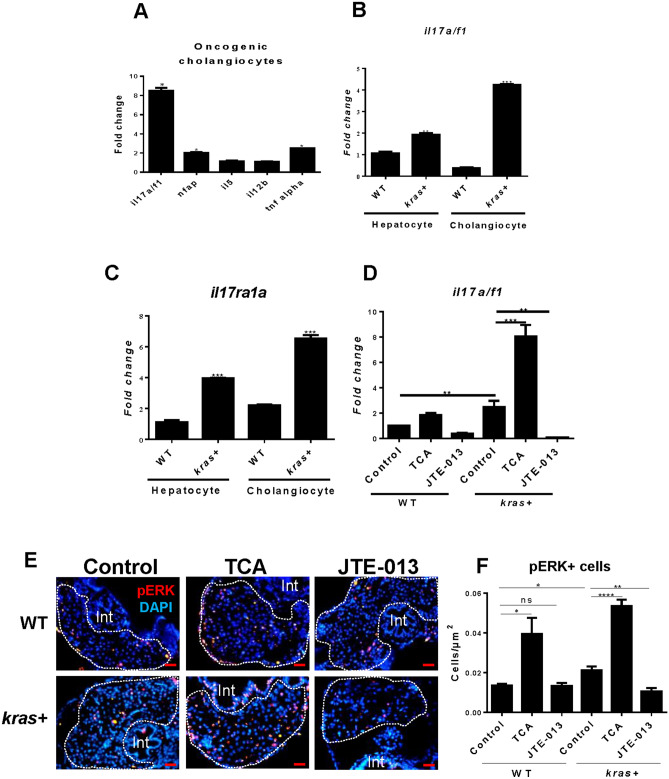
Expression of selected cytokine mRNAs in hepatocytes and cholangiocytes of the liver in adult zebrafish. (A) Expression of selected cytokine mRNAs in cholangiocytes upon kras induction in hepatocytes. (B, C) Expression of il17a/f1 (B) and il17ra1a mRNAs in cholangiocytes and hepatocytes in WT and kras+ larvae following Dox induction from 3 to 8 dpf. (D) Expression of il17a/f1 mRNA in kras + and WT larvae treated with TCA and JTE-013 together with Dox from 3 to 8 dpf. In (A), gene expression values in the kras groups were normalized to their WT counterparts. In (BD), all values were normalized to WT hepatocyte value. (E, F) Representative images of il17a/f1 downstream maker p-ERK staining (E) and quantification of pERK stained cells (F) in kras+ and WT zebrafish larvae treated with TCA and JTE-013 from 3 to 8 dpf. N = 10 per group. Scale bars, 20 μm Statistical significance: *P˂0.05.

Figure Data
Acknowledgments
This image is the copyrighted work of the attributed author or publisher, and ZFIN has permission only to display this image to its users. Additional permissions should be obtained from the applicable author or publisher of the image. Full text @ Sci. Rep.