FIGURE SUMMARY
Title

L-Carnitine ameliorates congenital myopathy in a tropomyosin 3 de novo mutation transgenic zebrafish

Authors
Hsu, P.J., Wang, H.D., Tseng, Y.C., Pan, S.W., Sampurna, B.P., Jong, Y.J., Yuh, C.H.
Source
Full text @ J. Biomed. Sci.

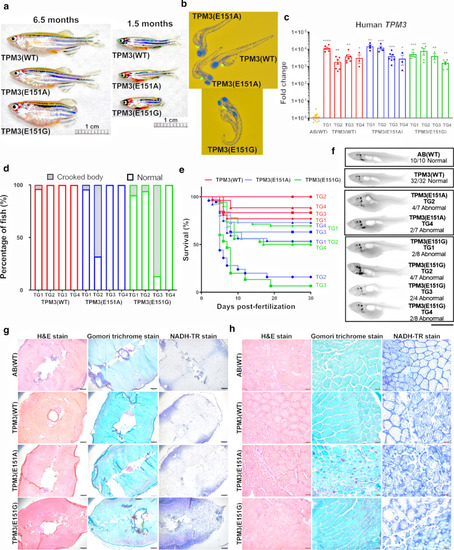
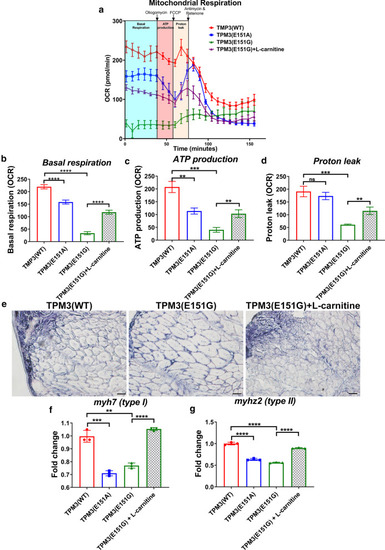
Appearance, survival rate, X-ray images and histopathological examinations of muscle in TPM3 transgenic zebrafish. a Appearance of F0 adult TPM3 transgenic fish at 6.5 months of age and F1 adult TPM3 transgenic fish at 1.5 months of age. Scale bar is 1 cm. b Representative images of the F1 larvae TPM3 transgenic fish. c Expression level of human TPM3 mRNA in TPM3 transgenic fish compared to non-transgenic control AB(WT). Orange bar represents AB(WT), red bar denotes four TG lines of TPM3(WT), blue color indicates four TG line of TPM3(E151A), green plot indicates four TG lines of TPM3(E151G). d Phenotypical analysis of the F1 larvae TPM3 transgenic fish, crooked body were indicated as grey color, TPM3 mutant lines exhibited higher percentage of abnormaility compared to TPM3(WT) e Survival rate of the F1 larva of TPM3 transgenic fish, TPM3 mutant lines exhibited lower survival rate compared to TPM3(WT). f X-ray images of skeleton alignment for adult AB(WT), TPM3(WT), TPM3(E151A), and TPM3(E151G). Zebrafish have 31 vertebrae in male and female fish. AB(WT) and TPM3(WT) exhibited normal skeleton alignment. TPM3(E151A) TG2 and TG4 showed abnormal skeleton alignment. All four independent lines of TPM3(E151G) transgenic zebrafish displayed some levels of abnormal skeleton alignment. Scale bar is 1 cm. g Hematoxylin and Eosin stain (HE) stain, modified Gomori trichrome stain, and NADH-TR stains of adult AB(WT) and adult F1 TPM3 transgenic zebrafish at 50X, scale bar is 200 µm. h Representative images of three staining at 400X, scale bar is 50 µm

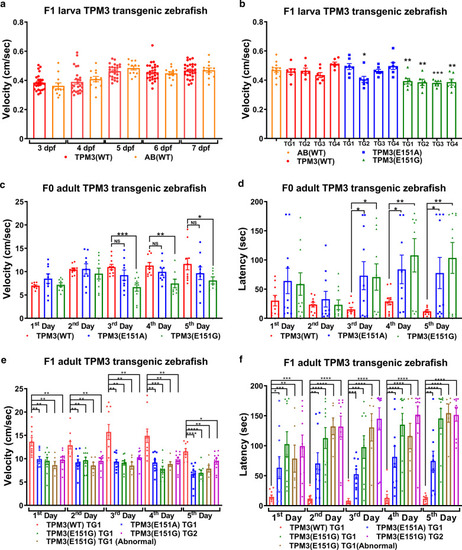
T-maze behavior test for adult TPM3 transgenic zebrafish, and the swimming velocity of larval TPM3 transgenic zebrafish. a The swimming velocity of F1 larva TPM3(WT) transgenic fish compared to non-transgenic AB(WT) control fish during the five days of testing. Red plot denotes TPM3(WT) fish (n = 28), orange plot represents AB(WT) fish (n = 12). There is no significant differences between TPM3(WT) and AB(WT). b The swimming velocity of F1 larva TPM3 transgenic fish at 7 dpf. Orange plot represents AB(WT) (n = 12), red plot denotes four TG lines of TPM3(WT) (n = 8 for each line), blue plot indicates four TG line of TPM3(E151A) (n = 8 for each line), green plot indicates four TG lines of TPM3(E151G) (n = 8 for each line). Four lines of TPM3(E151G) and TG2 of TPM3(E151A) significantly swim slower compared to AB(WT). c The swimming velocity of F0 adult TPM3 transgenic zebrafish during the five days of testing. Red plot represents TPM3(WT) (n = 10), blue plot indicates TPM3(E151A) (n = 10), green plot indicates TPM3(E151G) (n = 10). d Latency for memory test of F0 adult TPM3 transgenic zebrafish during the five days of testing. TPM3(WT), TPM3(E151A), and TPM3(E151G) are shown in red, blue, and green bars, respectively. e The swimming velocity of F1 adult TPM3 transgenic zebrafish during the five days of testing. Red plot represents TPM3(WT) TG1 (n = 10), blue plot denotes TPM3(E151A) TG1 (n = 10), green plot indicates TPM3(E151G) TG1 (n = 10), brown plot is TPM3(E151G) TG1 abnormal appearance (n = 6), and pink plot is TPM3(E151G) TG2 (n = 10). f Latency for memory test of F1 adult TPM3 transgenic zebrafish during the five days of testing. TPM3(WT) TG1, TPM3(E151A) TG1, TPM3(E151G) TG1, TPM3(E151G) TG1 abnormal appearance, and TPM3(E151G) TG2 are shown in red, blue, green, brown, and pink bars, respectively. Statistical significance was determined in comparison with AB(WT) and was determined using a t-test, *0.01 < P ≤ 0.05; **0.001 < P ≤ 0.01; ***0.0001 < P ≤ 0.001; ****P ≤ 0.0001

PHENOTYPE:
Fish:
Observed In:
Stage: Adult

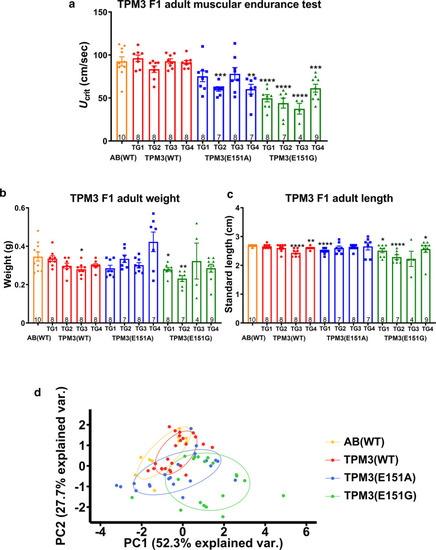
Muscle endurance test for adult F1 TPM3 transgenic zebrafish. a Critical swimming speed (Ucrit) was used to measure the muscle endurance using a swimming tunnel. The statistical significance was calculated in comparison with AB(WT). The orange plot is AB(WT) (n = 10), red plot is the four TG lines of TPM3(WT) (TG1, n = 8; TG2, n = 8; TG3, n = 8; TG4, n = 8), blue plot is the four TG lines of TPM3(E151A) (TG1, n = 8; TG2, n = 7; TG3, n = 8; TG4, n = 7), green plot is the four TG lines of TPM3(E151G) (TG1, n = 8; TG2, n = 7; TG3, n = 4; TG4, n = 9). b The body weight of the 13 groups. c The standard length of the 13 groups. d Principal component analysis of endurance test for adult F1 TPM3 transgenic zebrafish. The first principal component (PC) accounted for 52.3% and the second PC for 27.7% of the variance. The orange plot is AB(WT) (n = 10), red is TPM3(WT) (n = 24), blue is TPM3(E151A) (n = 22), and green is TPM3(E151G) (n = 19). Statistical significance was determined using a t-test, *0.01 < P ≤ 0.05; **0.001 < P ≤ 0.01; ***0.0001 < P ≤ 0.001; ****P ≤ 0.0001

l-Carnitine treatment ameliorates swimming behavior of TPM3(E151G) larva and muscle endurance of TPM3(E151G) adult transgenic zebrafish. a F3 larvae TPM3(E151G) fish (n = 8) were treated with five different chemicals starting at 28 h-post-fertilization (hpf) for six days, and larvae swimming behavior was tested at 7 day-post-fertilization (dpf). l-Carnitine significantly increased the swimming velocity compared to un-treated control. b Five different chemicals were used to treat F3 TPM3(E151A) larvae (n = 8). l-Carnitine does not improve the swimming velocity for TPM3(E151A) transgenic fish. c AB(WT) larvae with and without l-carnitine treatment (n = 16). l-Carnitine has no effect on non-transgenic AB(WT) fish. d ATP treatment of F3 TPM3(E151G) larvae considerably improved the swimming speed. e ATP treatments on F3 TPM3(WT) larvae showed no improving effect. f F3 adult TPM3(E151G) fish (n = 8) were treated with l-carnitine starting at 28 hpf for one month, with a muscle endurance test conducted at 1 month of age in a swimming tunnel. g The body weight of the l-carnitine treated TPM3(E151G) transgenic fish. h The standard length of the L-carnitine treated TPM3(E151G) transgenic fish. i PCA of endurance test for adult F3 TPM3(WT) and TPM3(E151G) transgenic zebrafish after l-carnitine treatment. Red plot denotes TPM3(WT), green plot is TPM3(E151G), and dark green plot represents TPM3(E151G) transgenic zebrafish after l-carnitine treatment. Statistical significance was determined using a t-test, *0.01 < P ≤ 0.05; **0.001 < P ≤ 0.01; ***0.0001 < P ≤ 0.001; ****  ≤ 0.0001

l-Carnitine treatment increased mitochndria activity and the type I and type II myosin light chain expression of TPM3(E151G) larva. Mitochondrial respiration of TPM3 transgenic zebrafish via seahorse. a Schematic and oxygen consumption rate (OCR). OCR was measured under basal conditions followed by the sequential addition of oligomycin (0.5 μM), Carbonyl cyanide-4-(trifluoromethoxy) phenylhydrazone (FCCP) (4 μM), rotenone (1 μM), or antimycin A (1 μM). b Basal respiration, c ATP production, and d proton leak of OCR measurement. e NADH-TR stains of TPM3(WT), TPM3(E151G) and one month of L-carnitine treated TPM3(E151G) transgenic zebrafish at 400X, scale bar is 50 µm. f the expression level of myh7 and gmyhz2 from TPM3 transgenic fish (F3) treated with l-carnitine from 28 hpf to 7 dpf cpmpared to TPM3(WT). Statistical significance was determined using a t-test, *0.01 < P ≤ 0.05; **0.001 < P ≤ 0.01; ***0.0001 < P ≤ 0.001; ****P ≤ 0.0001

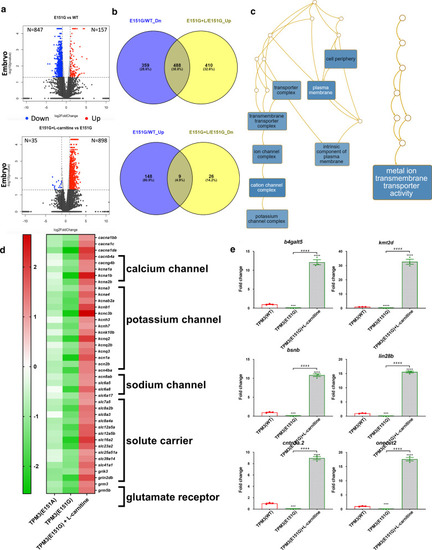
Deep sequencing data for TPM3 transgenic zebrafish. a Volcano plot of genes differentially expressed between TPM3(E151G) mutant compared to TPM3(WT) (upper panel) and TPM3(E151G)-l-carnitine treatment compared to TPM3(E151G) (lower panel). b Venn diagram showing the overlap genes of downregulated in TPM3(E151G) compared to TPM3(WT) and upregulated in TPM3(E151G)-l-carnitine compared to no treatment TPM3(E151G) (upper panel) and overlap genes of upregulated in TPM3(E151G) compared to TPM3(WT) and downregulated in TPM3(E151G)-l-carnitine compared to no treatment TPM3(E151G) (lower panel). c Gene ontology analysis revealed the genes involved in metal ion transmembrane transporter activity are downregulated in TPM3(E151G) and reversed by l-carnitine treatment. d Unsupervised cluster analysis and heat-map including genes involved in calcium, potassium and sodium channel, solute carriers, glutamate receptor are downregulated in TPM3(E151A), reduced more in TPM3(E151G), and upregulated by l-carnitine treatment. The red and green indicate high and low expression of Log2 ratio, respectively. The results were obtained from next-generation deep sequencing. e The expression pattern of selected candidate genes of muscle specimens from embryos of TPM3(E151G) and l-carnitine-treated TPM3(E151G) compared with TPM3(WT) transgenic fish by qRT-PCR. Statistical significance was determined using a t-test, *0.01 < P ≤ 0.05; **0.001 < P ≤ 0.01; ***0.0001 < P ≤ 0.001; ****P ≤ 0.0001

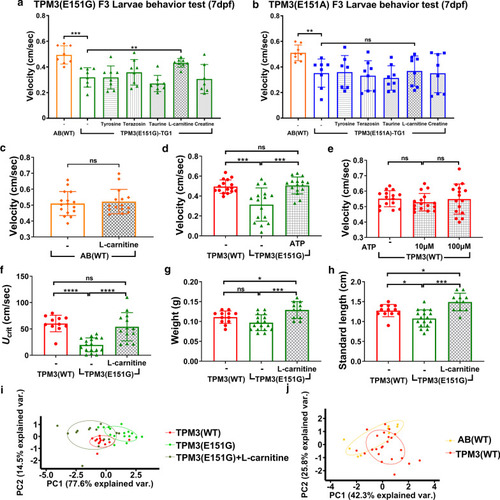
Analysis and interpretation the embryos of TPM3(E151A) and TPM3(E151G) transgenic fish with ingenuity pathway analysis. a List canonical signaling pathways and metabolic pathways affected by the TPM3(E151A), TPM3(E151G) and l-carnitine treated TPM3(E151G) by IPA analysis presented as hierarchical clustering. b List the upstream molecules related to the changing molecules in the TPM3(E151A), TPM3(E151G) and l-carnitine treated TPM3(E151G), and predict whether they are activated or inhibited based on the research literature presented as hierarchical clustering. c List of various analytical diseases and biological functions dysregulated by TPM3(E151A), TPM3(E151G) and l-carnitine treated TPM3(E151G) presented as hierarchical clustering. d Fatty acid metabolism is downregulated in TPM3(E151G) (left) and upregulated by l-carnitine treatment in TPM3(E151G) (right). The genes differential expressed are shown in red or blue indicated up-regulated or downregulated respectively. The blue or orange color in the center indicated fatty acid metabolism are downregulated or upregulated respectively

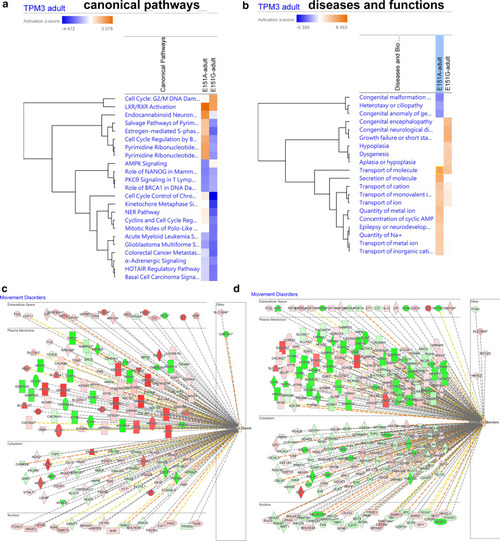
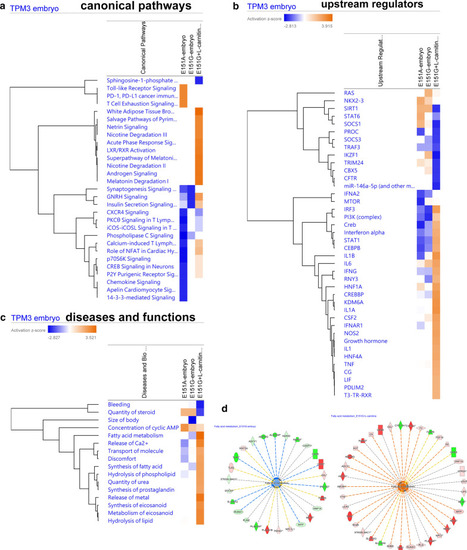
Ingenuity pathway analysis (IPA) network and canonical pathway analysis for the genes dysregulated in the TPM3(E151A) and TPM3(E151G) adult transgenic fish. a List canonical signaling pathways and metabolic pathways affected by the TPM3(E151A) and TPM3(E151G) adult by IPA analysis presented as hierarchical clustering. b List of various analytical diseases and biological functions dysregulated by TPM3(E151A) and TPM3(E151G) adult presented as hierarchical clustering. c Movement disorders is dysregulated in TPM3(E151A) adult fish presented as cellular compartment view. d Movement disorders is dysregulated in TPM3(E151G) adult fish. The genes differential expressed are shown in red or blue indicated up-regulated or downregulated respectively

Acknowledgments
This image is the copyrighted work of the attributed author or publisher, and ZFIN has permission only to display this image to its users. Additional permissions should be obtained from the applicable author or publisher of the image. Full text @ J. Biomed. Sci.