IMAGE

Fig. 7

ID
ZDB-IMAGE-210117-63
Source
Figures for Hsu et al., 2021
Image
Figure Caption

Fig. 7

Analysis and interpretation the embryos of
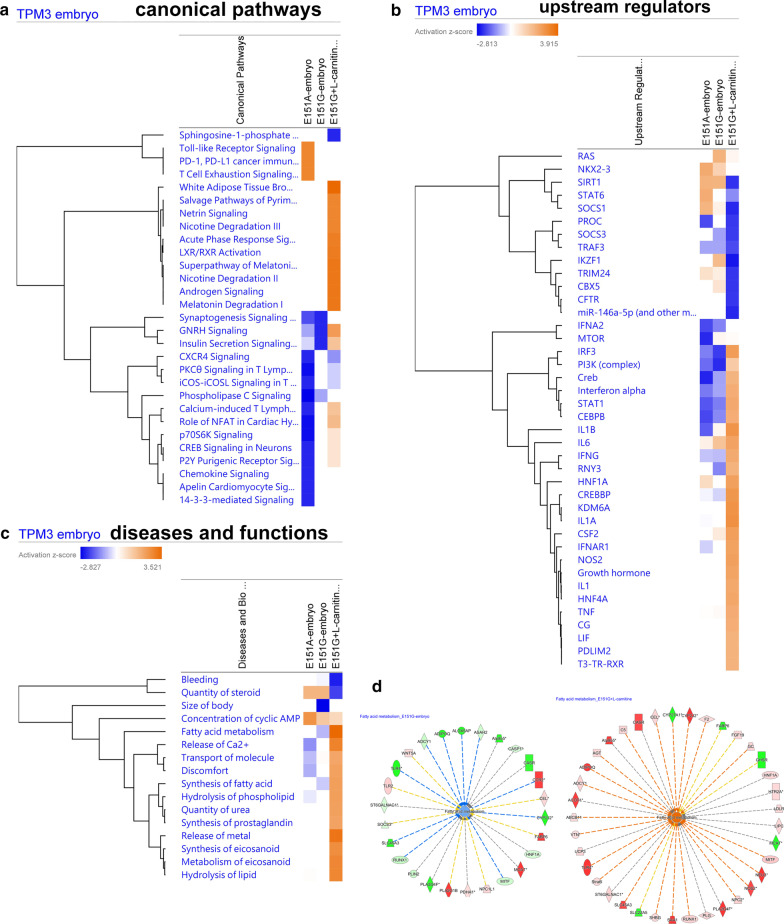
 TPM3(E151A) and TPM3(E151G) transgenic fish with ingenuity pathway analysis. a List canonical signaling pathways and metabolic pathways affected by the TPM3(E151A), TPM3(E151G) and l-carnitine treated TPM3(E151G) by IPA analysis presented as hierarchical clustering. b List the upstream molecules related to the changing molecules in the TPM3(E151A), TPM3(E151G) and l-carnitine treated TPM3(E151G), and predict whether they are activated or inhibited based on the research literature presented as hierarchical clustering. c List of various analytical diseases and biological functions dysregulated by TPM3(E151A), TPM3(E151G) and l-carnitine treated TPM3(E151G) presented as hierarchical clustering. d Fatty acid metabolism is downregulated in TPM3(E151G) (left) and upregulated by l-carnitine treatment in TPM3(E151G) (right). The genes differential expressed are shown in red or blue indicated up-regulated or downregulated respectively. The blue or orange color in the center indicated fatty acid metabolism are downregulated or upregulated respectively

Acknowledgments
This image is the copyrighted work of the attributed author or publisher, and ZFIN has permission only to display this image to its users. Additional permissions should be obtained from the applicable author or publisher of the image. Full text @ J. Biomed. Sci.