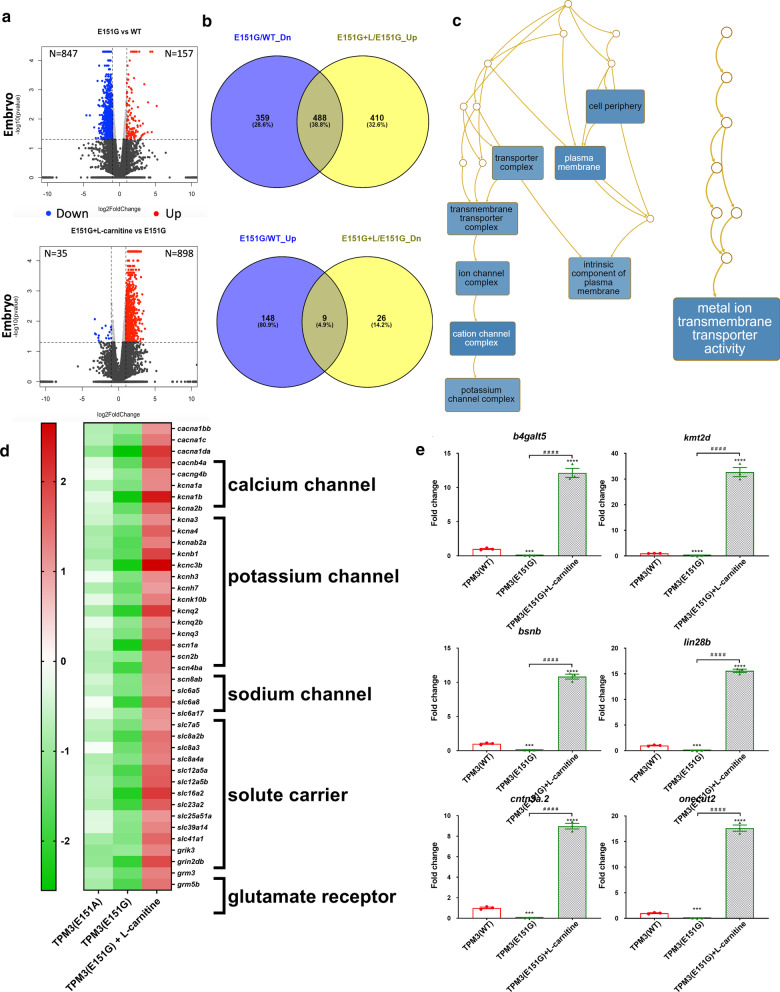
IMAGE

Fig. 6

ID
ZDB-IMAGE-210117-62
Genes
Source
Figures for Hsu et al., 2021
Image
Figure Caption

Fig. 6

Deep sequencing data for TPM3 transgenic zebrafish. a Volcano plot of genes differentially expressed between TPM3(E151G) mutant compared to TPM3(WT) (upper panel) and TPM3(E151G)-l-carnitine treatment compared to TPM3(E151G) (lower panel). b Venn diagram showing the overlap genes of downregulated in TPM3(E151G) compared to TPM3(WT) and upregulated in TPM3(E151G)-l-carnitine compared to no treatment TPM3(E151G) (upper panel) and overlap genes of upregulated in TPM3(E151G) compared to TPM3(WT) and downregulated in TPM3(E151G)-l-carnitine compared to no treatment TPM3(E151G) (lower panel). c Gene ontology analysis revealed the genes involved in metal ion transmembrane transporter activity are downregulated in TPM3(E151G) and reversed by l-carnitine treatment. d Unsupervised cluster analysis and heat-map including genes involved in calcium, potassium and sodium channel, solute carriers, glutamate receptor are downregulated in TPM3(E151A), reduced more in TPM3(E151G), and upregulated by l-carnitine treatment. The red and green indicate high and low expression of Log2 ratio, respectively. The results were obtained from next-generation deep sequencing. e The expression pattern of selected candidate genes of muscle specimens from embryos of TPM3(E151G) and l-carnitine-treated TPM3(E151G) compared with TPM3(WT) transgenic fish by qRT-PCR. Statistical significance was determined using a t-test, *0.01 < P ≤ 0.05; **0.001 < P ≤ 0.01; ***0.0001 < P ≤ 0.001; ****P ≤ 0.0001

Figure Data
Acknowledgments
This image is the copyrighted work of the attributed author or publisher, and ZFIN has permission only to display this image to its users. Additional permissions should be obtained from the applicable author or publisher of the image. Full text @ J. Biomed. Sci.