FIGURE SUMMARY
Title

Impact of low-frequency coding variants on human facial shape

Authors
Liu, D., Alhazmi, N., Matthews, H., Lee, M.K., Li, J., Hecht, J.T., Wehby, G.L., Moreno, L.M., Heike, C.L., Roosenboom, J., Feingold, E., Marazita, M.L., Claes, P., Liao, E.C., Weinberg, S.M., Shaffer, J.R.
Source
Full text @ Sci. Rep.

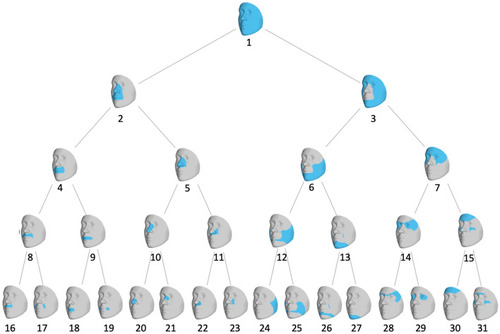
Hierarchical clustering of facial shape. Global-to-local facial segmentation obtained using hierarchical spectral clustering. Segments are colored in blue. The highest-level segment representing the full face was split into two sub-segments, and this bifurcation process was repeated until a five-level hierarchy comprising 31 segments was formed.

Composite Manhattan plot showing results across 31 facial modules. Manhattan plot showing the position of genes on the x axis and MultiSKAT p-values on the y axis. A total of 31 points are plotted for each gene, representing their p-values in each of the 31 modules. The red horizontal line indicates the significance threshold (3.3 × 10–7). The associated facial modules and the corresponding p-value for each gene that surpassed the threshold (marked as green dots) are shown above the Manhattan plot. The numbers to the bottom left of the facial images indicate the module identifiers in Fig. 1.

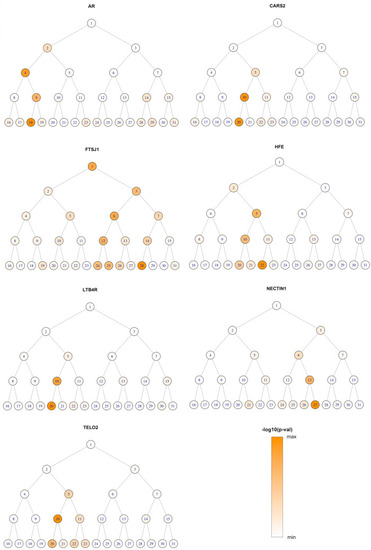
Module-wide association results for significant genes. For each gene, the –log10 p-value is shown as color shades ranging from min to max, for 31 facial segments arranged the same way as Fig. 1. The global-to-local phenotyping enabled the discovery of genetic effects at different scales.

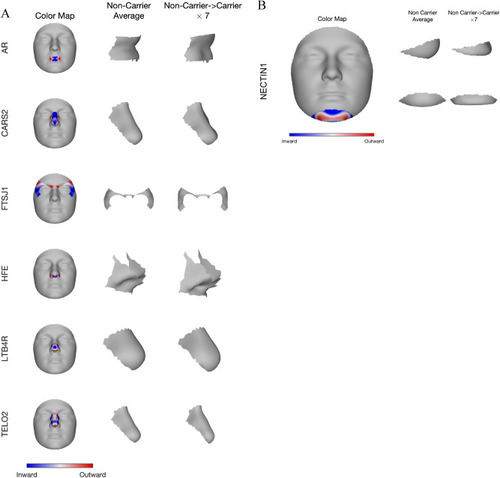
Phenotypic effect of the seven identified genes in their top associated module. Blue and red indicate a local shape depression and protrusion, respectively, due to carrying the low-frequency variants in the gene. (A) First column shows gene effect on a representative module placing on the full face; middle column shows the lateral view of the average shape of the corresponding module among people who do not carry any variant in the gene; right column shows the change in the shape of the same module, from non-carrier to carrier, multiplied by a constant (7), to make the changes more visibly distinctive. (B) For NECTIN1 gene, we show both lateral (top) and frontal (bottom) view of its effect on chin shape. NECTIN1 variant carriers on average displayed a sharper, more protruding chin.

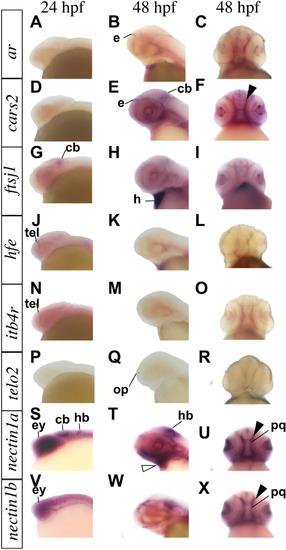
Whole-mount RNA in situ hybridization demonstrating genes expression in zebrafish. Genes expression pattern in lateral and ventral views at the indicated embryonic stages as hours per fertilization (hpf).
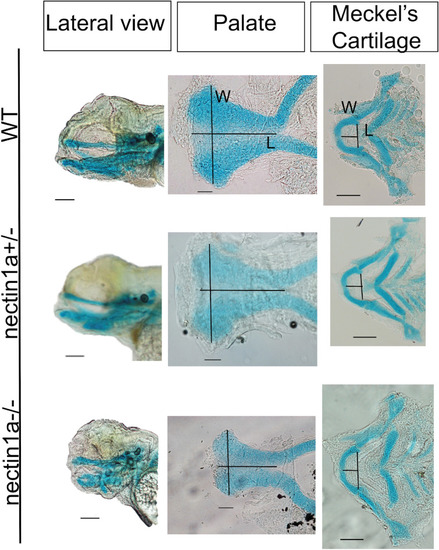
 cars2, nectin1a and nectin1b are expressed in zebrafish palate (solid arrow). nectin1a is expressed in the lower jaw at 48 hpf (hollow arrow). cb cerebellum, e epiphysis, ey eye, h heart, hb hindbrain, op olfactory placode, pq palate quadrate, tel telencephalon.

Alcian blue images for nectin1a zebrafish mutant compared to wild type at day 5. Top images: wild type alcian blue lateral view, palate and Meckel’s cartilage. Middle images: heterozygous nectin1a embryo alcian blue. Bottom images: homozygous nectin1a mutant lateral view. The length of the palate was measured from the anterior midpoint to the posterior midpoint of the palate. The width was measured as the maximum distance between the 2 lateral borders at the anterior area. The length of the Meckel’s cartilage was measured from the midline of the Meckel’s cartilage to the midline of an imaginary line drawn joining the joints between the Meckel’s cartilage and the palatoquadrate. The width was measured from the junction of the Meckel’s cartilage and the palatoquadrate of one side to the other side. Compared to wild type animals. nectin1a mutants have smaller and shorter palate, and shorter and wider Meckel’s cartilage. L length, W width. Scale bar: 10 μm.

Acknowledgments
This image is the copyrighted work of the attributed author or publisher, and ZFIN has permission only to display this image to its users. Additional permissions should be obtained from the applicable author or publisher of the image. Full text @ Sci. Rep.