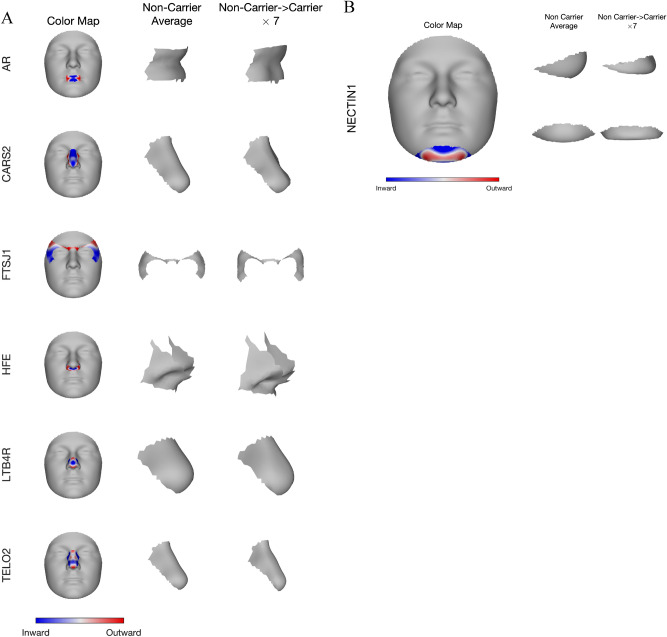
IMAGE

Figure 4

ID
ZDB-IMAGE-210117-54
Source
Figures for Liu et al., 2021
Image
Figure Caption

Figure 4

Phenotypic effect of the seven identified genes in their top associated module. Blue and red indicate a local shape depression and protrusion, respectively, due to carrying the low-frequency variants in the gene. (A) First column shows gene effect on a representative module placing on the full face; middle column shows the lateral view of the average shape of the corresponding module among people who do not carry any variant in the gene; right column shows the change in the shape of the same module, from non-carrier to carrier, multiplied by a constant (7), to make the changes more visibly distinctive. (B) For NECTIN1 gene, we show both lateral (top) and frontal (bottom) view of its effect on chin shape. NECTIN1 variant carriers on average displayed a sharper, more protruding chin.

Acknowledgments
This image is the copyrighted work of the attributed author or publisher, and ZFIN has permission only to display this image to its users. Additional permissions should be obtained from the applicable author or publisher of the image. Full text @ Sci. Rep.