
- Title
-
Design, synthesis and biological evaluation of novel pyxinol derivatives with anti-heart failure activity
- Authors
- Liu, J., Liu, Y., Yu, H., Zhang, Y., Hsu, A.C., Zhang, M., Gou, Y., Sun, W., Wang, F., Li, P., Liu, J.
- Source
- Full text @ Biomed. Pharmacother.
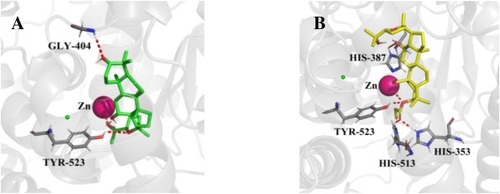
Fig. 1. A) Best predicted binding mode of pyxinol at ACE binding site. B) Best predicted binding mode of 2b at ACE binding site. |
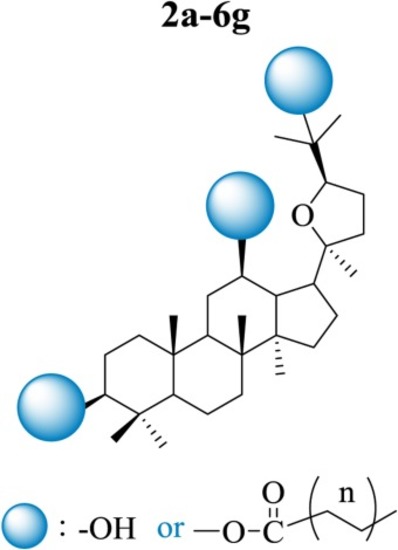
Fig. 2. Design of fatty acid derivatives of pyxinol. |
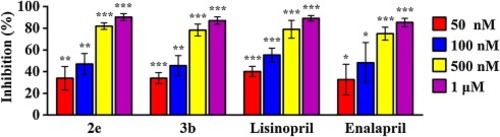
Fig. 3. Dose Response Curves of compounds 2e, 3b with ACE inhibiton activity. Data are presented as means ± SD (n = 3). *p < 0.05, **p < 0.01, ***p < 0.001 vs control. |
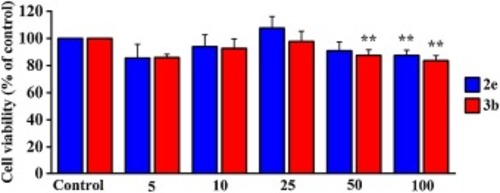
Fig. 4. Cell viability of H9c2 cells treated with different concentrations of 2e and 3b for 24 h, respectively. Data are presented as means ± SD (n = 3). **p < 0.01 vs control. |
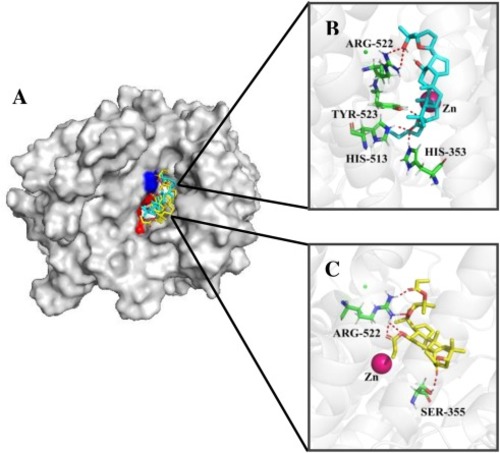
Fig. 5. (A) Docking poses for compound 2e in cyan, 3b in yellow, on ACE (PDB: 1O8A). Identical residues were shown in blue and different residues in red. (B) Binding mode of compound 2e. (C) Binding mode of compound 3b. Green sticks: residues involved in the interactions; Red dashed lines: hydrogen bonds; Magenta sphere: catalytic zinc ion. (For interpretation of the references to colour in the Figure, the reader is referred to the web version of this article). |
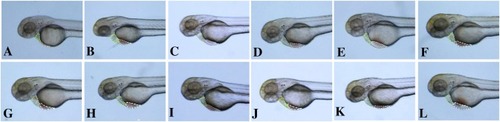
Fig. 6. Heart and veins in Zebrafish. (A) zebrafish control group; (B) zebrafish heart failure model; (C-E) treated with 2e, 3b and pyxinol at 0.5 μg/mL; (F-I) treated with 2e, 3b, pyxinol and Enalapril at 1 μg/mL; (J-L) treated with 2e, 3b and pyxinol at 10 μg/mL. Green dotted line: Heart and heart dilatation; white dotted line: veins and venous congestion. (For interpretation of the references to colour in the Figure, the reader is referred to the web version of this article). PHENOTYPE:
|
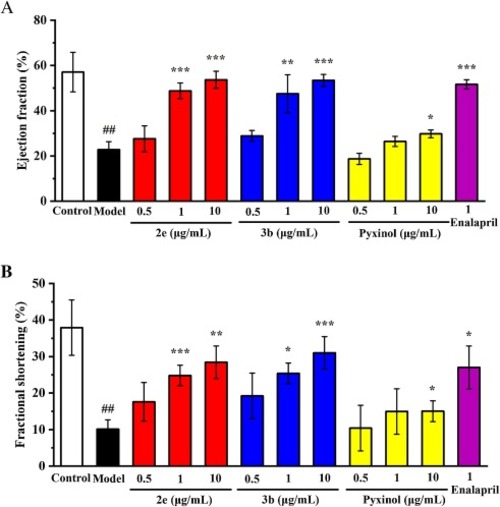
Fig. 7. The effect of compounds 2e, 3b and pyxinol on ejection fraction and fractional shortening in the zebrafish heart failure model at 0.5, 1, 10 μg/mL and Enalapril at 1 μg/mL. (A) The effect on ejection fraction. (B) The effect on fractional shortening. Data were expressed as mean ± SD and percentage of control value (n = 3). ###p < 0.001, ##p < 0.01 vs control; ***p < 0.001, **p < 0.01, *p < 0.05 vs model group. PHENOTYPE:
|
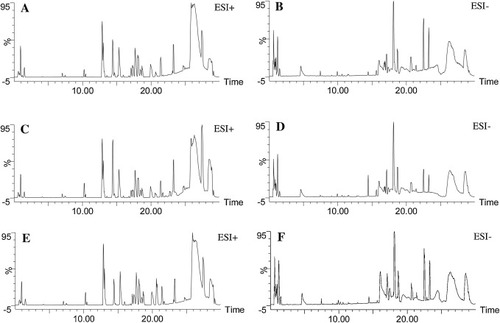
Fig. 8. The typical BPI chromatograms of control group (A,B), model group (C,D) and 2e group (E,F). |
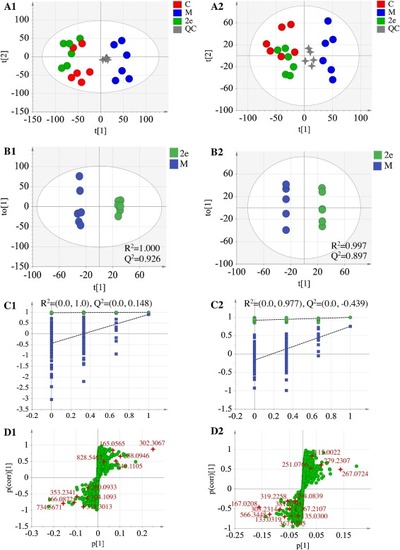
Fig. 9. (A) PCA score plots of control, model and 2e groups and (B/C/D) OPLS-DA/Permutation test/S-plots of model and 2e groups in ESI + mode (A1/B1/C1/D1) and ESI- (A2/B2/C2/D2). “M” represents model group; “C” represents control group. |
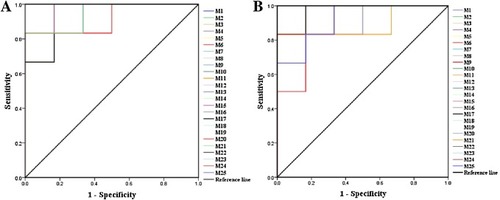
Fig. 10. The ROC curves generated using 25 biomarkers contributing to (A) heart failure progress between the model group and the control group, (B) 2e treatment between the model group and 2e group (the numbers are consistent with No. in Table 3). |
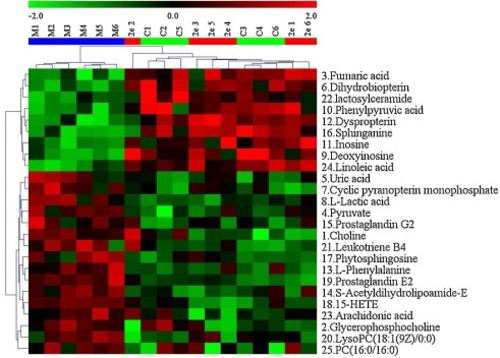
Fig. 11. The heatmap of all potential biomarkers. |
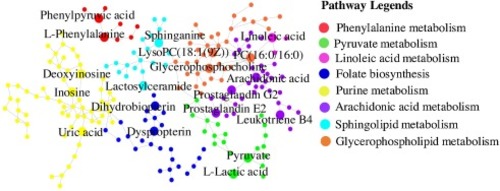
Fig. 12. The metabolic pathways. |
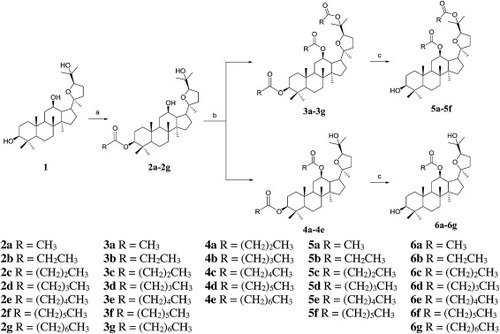
Scheme 1. Synthesis of pyxinol derivatives 2b-2f, 3a-3 g, 4a-4e, 5a-5f and 6a-6 g. Reagents and conditions: (a). anhydride, CH2Cl2, DMAP, Et3N, 0 ℃-rt, 4 h; (b). anhydride, CH2Cl2, DMAP, Et3N, 0 ℃-50 ℃, 24 h; (c). ethanol, KOH, rt, 24 h. |