
Image
|
Figure Caption
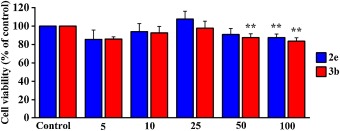
Fig. 4 Fig. 4. Cell viability of H9c2 cells treated with different concentrations of 2e and 3b for 24 h, respectively. Data are presented as means ± SD (n = 3). **p < 0.01 vs control.
Acknowledgments
This image is the copyrighted work of the attributed author or publisher, and
ZFIN has permission only to display this image to its users.
Additional permissions should be obtained from the applicable author or publisher of the image.
Full text @ Biomed. Pharmacother.