
Image
|
Figure Caption
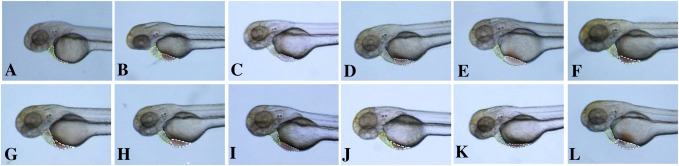
Fig. 6 Fig. 6. Heart and veins in Zebrafish. (A) zebrafish control group; (B) zebrafish heart failure model; (C-E) treated with 2e, 3b and pyxinol at 0.5 μg/mL; (F-I) treated with 2e, 3b, pyxinol and Enalapril at 1 μg/mL; (J-L) treated with 2e, 3b and pyxinol at 10 μg/mL. Green dotted line: Heart and heart dilatation; white dotted line: veins and venous congestion. (For interpretation of the references to colour in the Figure, the reader is referred to the web version of this article).
Figure Data
Acknowledgments
This image is the copyrighted work of the attributed author or publisher, and
ZFIN has permission only to display this image to its users.
Additional permissions should be obtained from the applicable author or publisher of the image.
Full text @ Biomed. Pharmacother.