
Image
|
Figure Caption
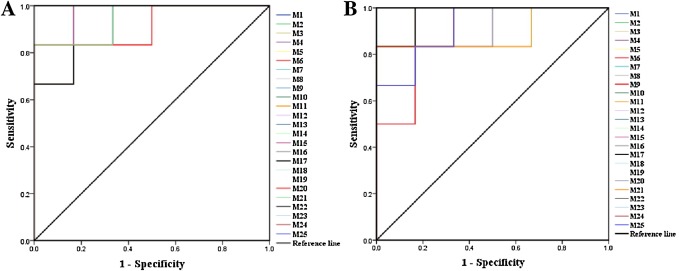
Fig. 10 Fig. 10. The ROC curves generated using 25 biomarkers contributing to (A) heart failure progress between the model group and the control group, (B) 2e treatment between the model group and 2e group (the numbers are consistent with No. in Table 3).
Acknowledgments
This image is the copyrighted work of the attributed author or publisher, and
ZFIN has permission only to display this image to its users.
Additional permissions should be obtained from the applicable author or publisher of the image.
Full text @ Biomed. Pharmacother.