
Image
|
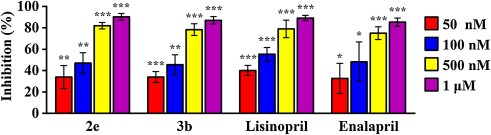
Figure Caption
Fig. 3 Fig. 3. Dose Response Curves of compounds 2e, 3b with ACE inhibiton activity. Data are presented as means ± SD (n = 3). *p < 0.05, **p < 0.01, ***p < 0.001 vs control.
Acknowledgments
This image is the copyrighted work of the attributed author or publisher, and
ZFIN has permission only to display this image to its users.
Additional permissions should be obtained from the applicable author or publisher of the image.
Full text @ Biomed. Pharmacother.