
- Title
-
Cohesin Components Stag1 and Stag2 Differentially Influence Haematopoietic Mesoderm Development in Zebrafish Embryos
- Authors
- Ketharnathan, S., Labudina, A., Horsfield, J.A.
- Source
- Full text @ Front Cell Dev Biol
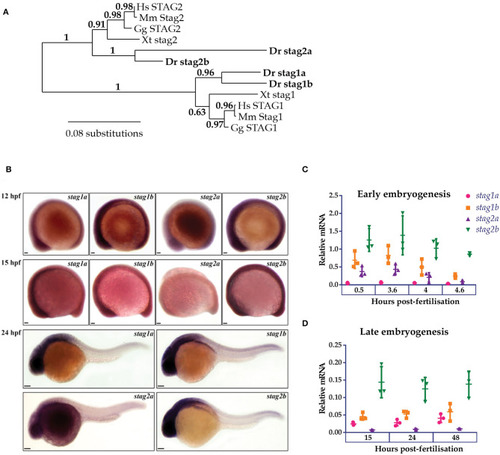
Phylogenetic analysis and embryonic expression of Stag paralogues. |
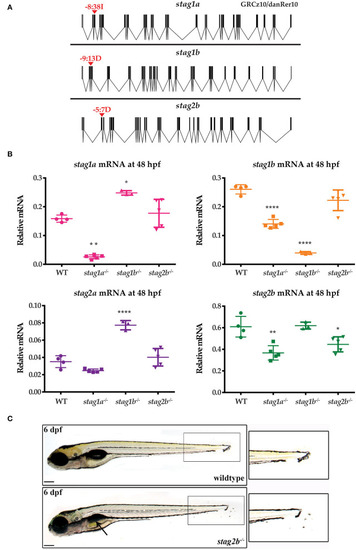
Generation of zebrafish |
|

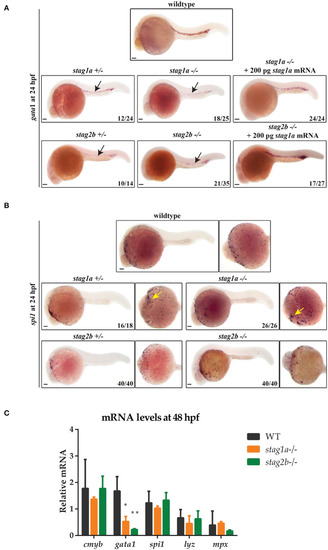
EXPRESSION / LABELING:
PHENOTYPE:
|
EXPRESSION / LABELING:
PHENOTYPE:
|
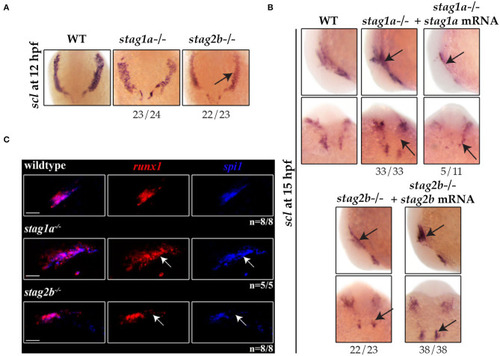
EXPRESSION / LABELING:
PHENOTYPE:
|

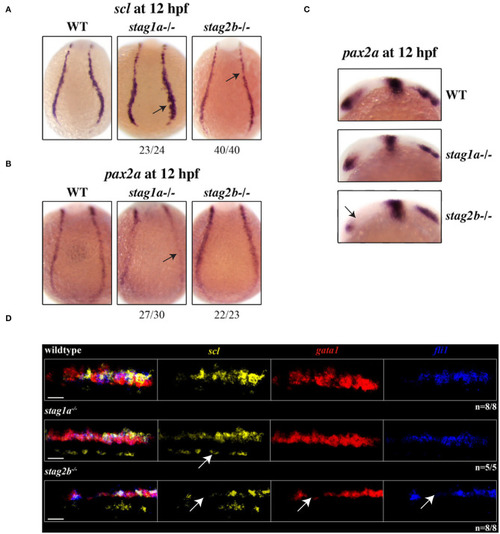
Hypothetical model explaining the effects of Stag1a and Stag2b loss on primitive erythropoiesis. In |

Unillustrated author statements PHENOTYPE:
|