FIGURE

Figure 1

ID
ZDB-FIG-201230-18
Publication
Ketharnathan et al., 2020 - Cohesin Components Stag1 and Stag2 Differentially Influence Haematopoietic Mesoderm Development in Zebrafish Embryos
Other Figures
All Figure Page
Back to All Figure Page
Figure 1

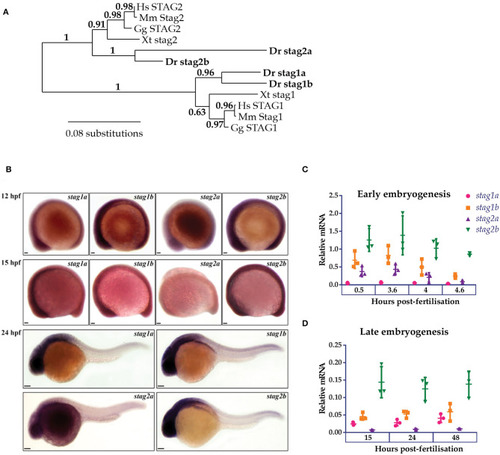
Phylogenetic analysis and embryonic expression of Stag paralogues. (A) Phylogenetic analysis of predicted protein sequences using the maximum likelihood approach. The accession numbers for the protein sequences used in this analysis are listed in Supplementary Table 1. (B) Whole-mount in situ hybridization of stag1a, stag1b, stag2a, and stag2b during early embryogenesis. Lateral views are shown, anterior to the left. Scale bars are 50 μm for embryos at 12 and 15 hpf and 100 μm for embryos at 24 hpf. (C,D) mRNA expression of stag paralogues at the indicated time points during (C) early embryogenesis and (D) late embryogenesis. Each data point represents mRNA isolated from a pool of 30 embryos. Graphs are mean +/- one standard deviation. Expression was normalized to the reference genes, b-actin and rpl13a (Supplementary Figure 1A).

Expression Data
Genes:
Fish:
Anatomical Terms:
Stage Range: 1-cell to Long-pec

Expression Detail
Antibody Labeling
Phenotype Data

Phenotype Detail
Acknowledgments
This image is the copyrighted work of the attributed author or publisher, and ZFIN has permission only to display this image to its users. Additional permissions should be obtained from the applicable author or publisher of the image. Full text @ Front Cell Dev Biol