
- Title
-
Ligand Binding to the Collagen VI Receptor Triggers a Talin-to-RhoA Switch that Regulates Receptor Endocytosis
- Authors
- Bürgi, J., Abrami, L., Castanon, I., Abriata, L.A., Kunz, B., Yan, S.E., Lera, M., Unger, S., Superti-Furga, A., Peraro, M.D., Gaitan, M.G., van der Goot, F.G.
- Source
- Full text @ Dev. Cell
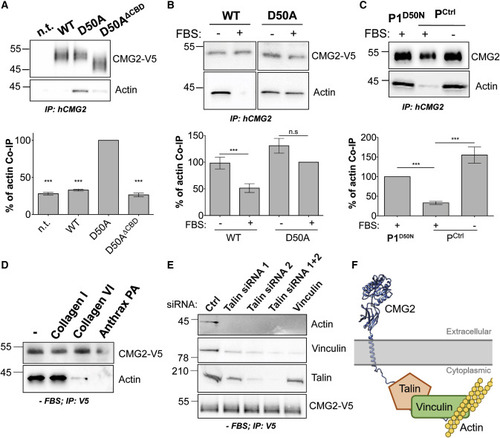
Figure 1. CMG2 Interaction with the Actin Cytoskeleton (A) HeLa cells transiently transfected with cDNA expressing CMG2-V5 WT, D50A, or D50A with a deletion of the predicted CBD (D50AΔCBD) were lysed and CMG2 immunoprecipitated. IPs were then analyzed by SDS-PAGE and western blotting against actin and CMG2-V5. (B) HeLa cells were transiently transfected with cDNA expressing CMG2-V5 WT or D50A were FBS starved or not overnight, lysed and CMG2 immunoprecipitated. IPs were then analyzed by SDS-PAGE and western blotting against actin and CMG2-V5. (C) Control fibroblasts and fibroblasts from patient 1 carrying the D50N mutation. Cells were FBS starved or not overnight, lysed and CMG2 immunoprecipitated. IPs were then analyzed by SDS-PAGE and western blotting against actin and endogenous CMG2. (A–C) Actin was quantified by densitometry. Error bars represent standard error, n = 3; paired t test between D50A or D50N mutants and other constructs. n.s.: p > 0.05; ∗∗∗p < 0.001. (D) HeLa cells were transfected for 24 h with cDNA expressing CMG2 WT and plated on dishes coated with collagen I, collagen VI, or anthrax PA. After 1 h of adhesion, cells were lysed and CMG2 was immunoprecipitated. IPs were then analyzed by SDS-PAGE and western blotting against actin and CMG2-V5. (E) HeLa cells were transfected with siRNAs against talin (siRNA1 and 2), or vinculin for 72 h, and with cDNA expressing CMG2 WT for 24 h and finally serum starved overnight. Cells were then lysed, and CMG2 was immunoprecipitated. IPs were then analyzed by SDS-PAGE and western blotting against actin, vinculin, talin and CMG2-V5. (D and E) Representative experiment of n = 3. (F) Schematic representation of CMG2 interaction with the actin cytoskeleton. The cytoplasmic tail of CMG2 interacts with talin, which in turn interacts with vinculin, which is connected to actin. |
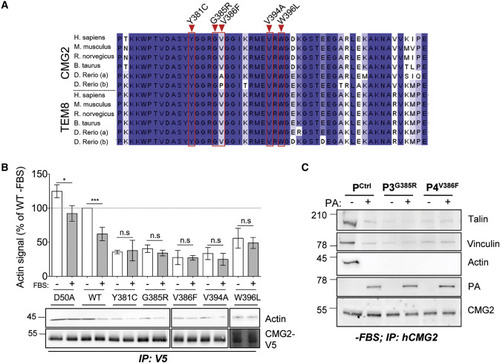
Figure 2. HFS Mutations Mapping to the CMG2 Cytoplasmic Tail (A) Sequence alignment of the highly conserved cytoplasmic domain of CMG2 and TEM8. The position of the cytoplasmic HFS mutations analyzed in this study are highlighted in red. (B) Top: quantification of the interaction between CMG2 and actin by densitometry. Each value was normalized to the average signal of actin bound to WT CMG2 in cells grown in complete medium. For statistical analysis, an unpaired t test was performed on normalized values comparing the non-starved and starved condition for each cDNA construct. n = 3, ∗∗∗p < 0.001; ∗p < 0.05. Bottom: HeLa cells were transfected for 24 h with cDNA expressing CMG2-V5 WT, and mutants, grown with or without FBS overnight. The cells were lysed, and CMG2 was immunoprecipitated (IP). Samples were analyzed by SDS-PAGE and western blotting against actin and V5. (C) Control, P3, and P4 patient fibroblasts were serum starved overnight and incubated or not with 500 ng mL−1 of PA at 4°C for 1 h plus 10 min at 37°C. IPs were performed as in (A). (B and C) Representative experiments of n = 3 independent experiments. |
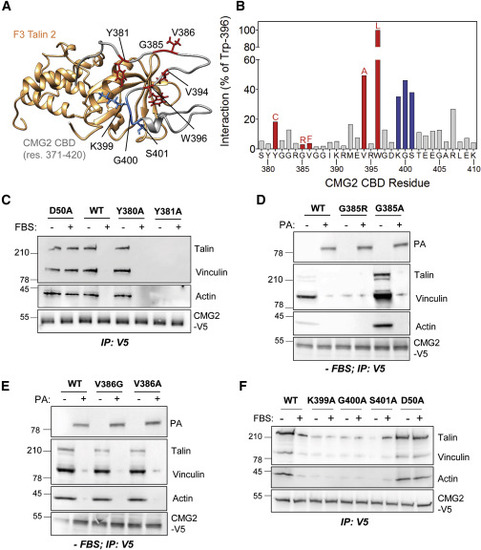
Figure 3. CMG2 Interaction with the Talin F3 Domain (A) MD simulation of the complexes modeled for CMG2 CBD bound to the talin F3 domain (PDB 3G9W). The set of interactions between residue W396 of CMG2 and the talin F3 domain was held constant during the simulation. Residues mutated in HFS patients are highlighted in red. The talin interaction motif consisting of K399, G400 and S401is highlighted in blue. (B) Based on the sum of the interactions found in four independent restrained simulations, an average number of interactions that each amino acid of CMG2 CBD makes with any amino acid of the talin F3 domain was determined. The values were normalized as a percent of the number of interactions observed for W396. The color code is similar as in (A). (C) HeLa cells were transfected for 24 h with cDNA expressing CMG2-V5 WT, D50A, Y380A and Y381A and the cells were grown with or without FBS overnight . CMG2 was then immunoprecipitated, and IPs were analyzed by SDS-PAGE and western blotting against talin, vinculin, actin and V5. (D) HeLa cells were transfected for 24 h with cDNA expressing CMG2-V5 WT, G385R and G385A and the cells were grown without FBS overnight and treated with 500 ng/ml of PA at 4°C for 1h and switched to 37°C for 10 minutes before lysis. CMG2 was then immunoprecipitated, and IPs were analyzed by SDS-PAGE and western blotting against talin, vinculin, actin, PA, and V5. (E) HeLa cells were transfected for 24 h with cDNA expressing CMG2-V5 WT, V386G and V386A and the cells were grown without FBS overnight and treated with 500 ng/ml of PA at 4°C for 1h and switched to 37°C for 10 minutes before lysis. CMG2 was then immunoprecipitated, and IPs were analyzed by SDS-PAGE and western blotting against talin, vinculin, actin, PA, and V5. (F) HeLa cells were transfected for 24 h with cDNA expressing CMG2-V5 WT, D50A, K399A, G400A and S401A and the cells were grown with or without FBS overnight . CMG2 was then immunoprecipitated, and IPs were analyzed by SDS-PAGE and western blotting against talin, vinculin, actin and V5. |
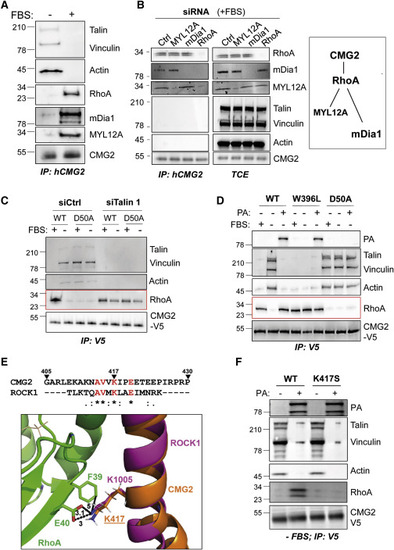
Figure 4. Ligand-Bound CMG2 Interacts with RhoA, mDia1, and MYL12A (A and B) (A) RPE1 cells were treated with or without FBS overnight (B) or were transfected with control siRNA or with siRNA against MYL12A, mDia1, or RhoA for 72 h in the presence of serum. The cells were then harvested, and CMG2 was immunoprecipitated. IPs and total cell extracts (TCE) were analyzed by SDS-PAGE and western blotting against talin, vinculin, actin, RhoA, mDia1, MYL12A, and CMG2. Right panel: schematic representation of the CMG2 interaction with RhoA and associated effector proteins. (C) HeLa cells were transfected with control siRNA or with siRNA against talin 1 for 72 h, then transfected for 24 h with the cDNA expressing CMG2-V5 WT or D50A and finally serum starved overnight or not. (D) HeLa cells were transfected for 24 h with cDNA expressing CMG2-V5 WT, D50A, or W396L and grown with or without FBS overnight. The cells were then incubated or not (control) with 500 ng/mL of PA at 4°C for 1 h and switched to 37°C for 10 min before lysis. (E) Sequence alignment between residues 405 to 430 of CMG2 and the RhoA-binding domain of ROCK. One dot, two dots, and a star, respectively, indicate a semi-conservative change, a conservative change, and a perfect match. RhoA (green) and ROCK (magenta) are from PDB 1S1C, and the CMG2 segment was modeled as an ideal helix (orange, slightly kinked at a proline). The distances (in Å) are shown in black dotted lines. (F) HeLa cells were transfected for 24 h with cDNA expressing CMG2 WT or K417S, serum starved overnight and treated with 500 ng/mL of PA at 4°C for 1 h and switched to 37°C for 10 min before lysis. (C, D, and F) After cell lysis, CMG2 was immunoprecipitated. IPs were then analyzed by SDS-PAGE and western blotting against talin, vinculin, actin, RhoA, and V5. Western blots are representative of at least three independent experiments. |
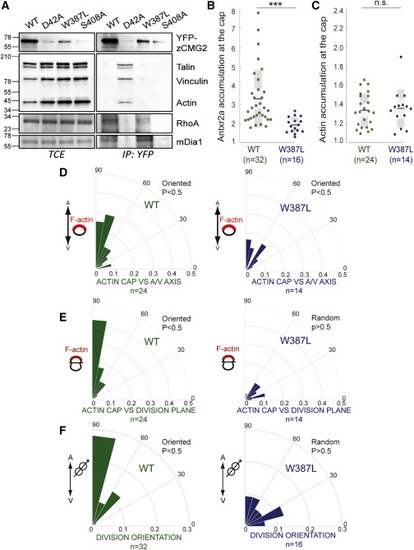
Figure 5. Loss of zAntrx2’s Ability to Bind Talin Affects Oriented Epiblast Cell Division (A) Zebrafish embryos were injected with mRNA of WT, W387L, or S408A zANtxr2a-eYFP, lysed, and zANtxr2a was immunoprecipitated followed by SDS-PAGE and western blotting against talin, vinculin, actin, RhoA, mDia, and GFP. (B) Antxr2a accumulation at the cap in epiblast cells. Zebrafish embryos were injected with either WT-Antxr2a-eYFP or W387L-Antxr2a-eYFP. The fluorescence intensity of the WT or the W387L fluorescently tagged versions of Antxr2a was then measured along the plasma membrane of epiblast cells. The intensity profile was fitted to a Gaussian distribution and the accumulation of the fluorescence intensity was calculated as described in the STAR Methods. (C) F-actin accumulation at the cap in epiblast cells. Zebrafish embryos were injected with LifeAct-mRFP biosensor and with either WT or W387L-Antxr2a-eYFP. The fluorescence intensity accumulation of the LifeAct-mRFP biosensor in one side of the cell was measured as described in (B). (B and C) For statistical analysis, an unpaired t test was performed comparing the WT to the W387L zAntrx2a mutants, ∗∗∗p < 0.001; n.s: p > 0.05 (D) Polar graphs showing the frequency distribution of the angles between the positions of the actin F-cap and the embryonic axis (A-V axis) in embryos expressing WT (green) or W387L (blue)-Antxr2a-eYFP. In all cases, the F-actin cap is aligned with the embryonic axis. (E) Polar graphs showing the frequency distribution of the angles between the F-actin cap and the division plane. Although in WT-Antxr2a-eYFP expressing embryos (green), there is a correlation between the F-actin cap and the division plane, in embryos expressing W387L-Antxr2a-eYFP (blue) this correlation is lost. (F) Polar graphs showing the frequency distribution of angles of division of epiblast cells. While divisions are oriented along the embryonic axis in embryos expressing WT-Antxr2a-eYFP (green), divisions are randomized in epiblast cells of embryos expression either W387L (blue). |
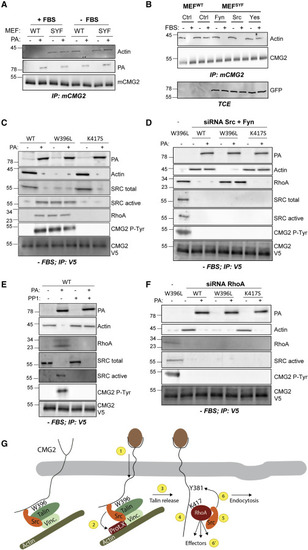
Figure 6. Src Requirement for TVA Release from CMG2 and RhoA Recruitment (A) Control MEFs and SYF MEFs were either treated with or without FBS overnight. Cells were then treated or not (control) with 500 ng/mL of PA for 1 h and lysed, and CMG2 was immunoprecipitated (IP). IPs were analyzed by SDS-PAGE and western blotting against actin, PA, and mouse CMG2. (B) Control MEFs and SYF MEFs were transfected for 24 h with cDNA expressing an empty control (Ctrl), GFP-fyn, GFP-src, or GFP-yes, then grown with or without FBS overnight, and CMG2 was immunoprecipitated. IPs and cell lysates were analyzed by SDS-PAGE and western blotting against actin, mouse CMG2, and GFP for fyn, src, and yes expression. (C–F) RPE1 cells were transfected with control siRNA (−) or with siRNA against (D) src and fyn or (F) RhoA for 72 h, then transfected for 24 h with cDNA expressing CMG2-V5 WT, W396L, or K417S and serum starved overnight. The cells were then treated or not with 500 ng/mL of PA (1 h 4°C plus 20 min at 37°C) or (E) the src-like kinase inhibitor PP1 (50 μM in serum-free medium) for 1 h at 37°C and lysed, and CMG2 was immunoprecipitated. IPs were analyzed by SDS-PAGE and western blotting against actin, RhoA, total src, active src, phospho-tyrosine, PA, and V5. For all experiments, n = 3 replicates were performed, and a representative experiment is shown. (G) Schematic representation of the herein identified steps that CMG2 undergoes when evolving from a ligand-free to a ligand-bound state. (1) Ligand binding to CMG2 leads to signal transduction across the plasma membrane and causes (2) release of src and phosphorylation of an unknown component. This leads to (3) talin, vinculin, and actin release from CMG2. (4) RhoA is then able to bind CMG2 lysine 417 and (5) to recruit active src. (6) src will then phosphorylate CMG2 for receptor endocytosis. (6′) Additional effector proteins are also recruited by RhoA and contribute to CMG2 function. |
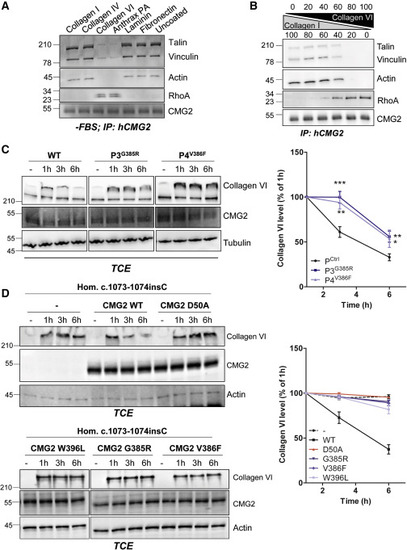
Figure 7. Effect of Cytosolic HFS Mutations on Collagen VI Degradation (A) RPE1 cells were serum starved overnight and plated the next day on dishes coated with either collagen I, IV, VI, PA, laminin, fibronectin, or uncoated. After 1 h of adhesion, the cells were lysed. (B) RPE1 cells were serum starved overnight and plated the next day on varying concentrations of collagen I and collagen VI. After 1 h of adhesion, the cells were lysed. (A and B) CMG2 was immunoprecipitated (IP). IPs were then analyzed by SDS-PAGE and western blotting against talin, vinculin, actin, RhoA, and CMG2. (C and D) (C) Control, P3, and P4 fibroblasts or (D) P7 fibroblasts recomplemented with WT or HFS CBD mutants were treated with purified full-length collagen VI at 1 μg/mL. Cells were harvested 1, 3, or 6 h later. Collagen VI degradation was assessed by SDS-PAGE using 4%–12% Bis-Tris gradient gels under non-reducing conditions and western blotting for collagen VI, endogenous CMG2, and tubulin as a loading control. Right panels: the collagen VI signal was quantified by densitometric analysis. Values were normalized to the collagen VI level at 1 h. Error bars represent SEM; (C) n = 11 or (D) n = 4 for control cells, (C) n = 6 or (D) n = 4 for mutants; ∗p < 0.05; ∗∗p < 0.01; ∗∗∗p < 0.001; two-tailed unpaired t test to control. |
Reprinted from Developmental Cell, 53, Bürgi, J., Abrami, L., Castanon, I., Abriata, L.A., Kunz, B., Yan, S.E., Lera, M., Unger, S., Superti-Furga, A., Peraro, M.D., Gaitan, M.G., van der Goot, F.G., Ligand Binding to the Collagen VI Receptor Triggers a Talin-to-RhoA Switch that Regulates Receptor Endocytosis, 418-430.e4, Copyright (2020) with permission from Elsevier. Full text @ Dev. Cell