- Title
-
Developmental Neurotoxicity of the Harmful Algal Bloom Toxin Domoic Acid: Cellular and Molecular Mechanisms Underlying Altered Behavior in the Zebrafish Model
- Authors
- Panlilio, J.M., Aluru, N., Hahn, M.E.
- Source
- Full text @ Environ. Health Perspect.
|
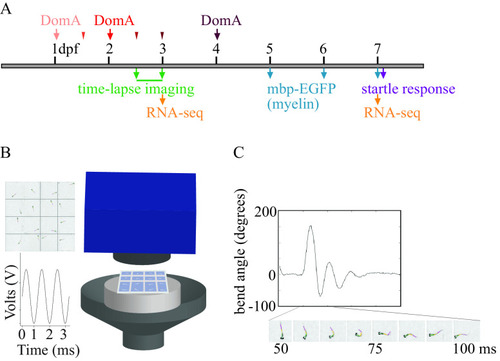
Experimental setup. (A) Exposure paradigm and end points assessed during zebrafish development. Domoic acid (DomA) was intravenously microinjected at one developmental time. Arrows indicate the three developmental time points that were used across all experiments [1, 2, and 4 d postfertilization (dpf)]. Thinner arrowheads represent other developmental time points at which DomA was injected in selected experiments (1.5, 2.5, and 3 dpf). For each injection category, the associated ranges of injection times in hours postfertilization (hpf) were: 1 dpf (28–32.5 hpf), 1.5 dpf (35.5–39 hpf), 2 dpf (47–53 hpf), 2.5 dpf (60–64 hpf), 3 dpf (71–77 hpf), and 4 dpf (99–105.5 hpf). Mortality, morphological defects, the presence or absence of convulsions, pectoral flapping, and touch responses were recorded daily from the day after exposure to 5 dpf. (B) Apparatus used to assess startle responses to auditory/vibrational stimuli. A speaker with a bonded platform was sent a 3-ms, 1,000-Hz pulse, which was then delivered to a 16-well plate. A high-speed camera captured startle responses at 1,000 frames per second. (See the section “Equipment” in the Supplemental Material.) (C) Sample trace of the bend angle over time as a larva undergoes startle. Bend angle is estimated by measuring the changes in angles between three line segments that outline the larvae. |
|
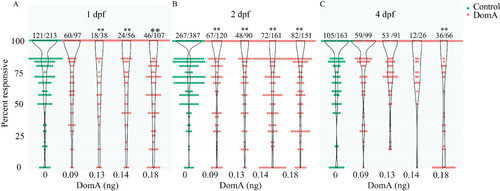
Startle responsiveness in zebrafish exposed to domoic acid (DomA) at 1, 2, and 4 d postfertilization (dpf). Fish were exposed to different doses of DomA at (A) 1 dpf, (B) 2 dpf, or (C) 4 dpf, and startle responses were measured at 7 dpf. Points represent the percentage response of individual fish to replicate stimuli. Ratios listed above represent the number of fish that responded to 100% of the stimuli over the total number of fish tested per treatment group. Violin plots are overlaid to show kernel density distribution of the data. Significance was determined with post hoc pairwise Dunnett comparisons following binomial modeling of percentage responsiveness. |
|
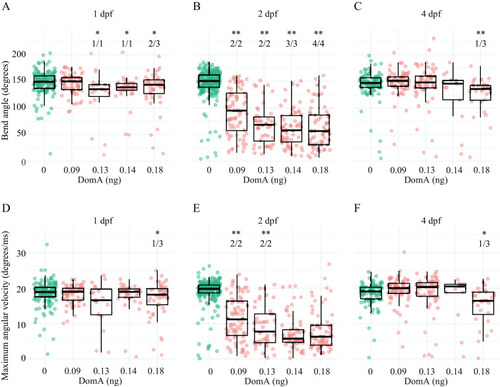
Kinematics for short latency C-bend (SLC) startles in zebrafish exposed to domoic acid (DomA) at 1, 2, and 4 d postfertilization (dpf). Fish were exposed to different doses of DomA at (A,D) 1 dpf, (B,E) 2 dpf, and (C,F) 4 dpf, and startle responses were measured at 7 dpf. SLC startle responses were characterized by (A–C) bend angle and (D–F) maximal angular velocity. Each point represents the median of up to seven responses for an individual fish. Box plots show the group medians, upper 75% quantiles, and lower 25% quantiles. Significance was determined using Behrens-Fisher |
|
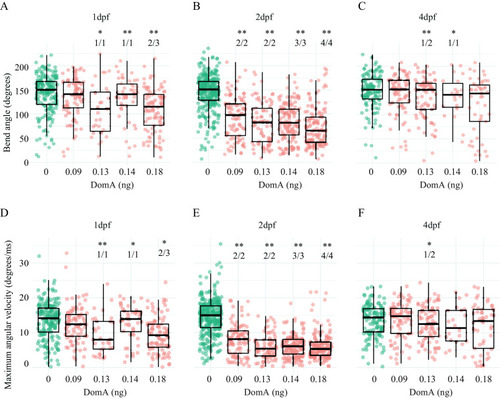
Kinematics for long latency C-bend (LLC) startles in zebrafish exposed to domoic acid (DomA) at 1, 2, and 4 d postfertilization (dpf). Fish were exposed to different doses of DomA at (A,D) 1 dpf, (B,E) 2 dpf, and (C,F) 4 dpf, and startle responses were measured at 7 dpf. LLC startle responses were characterized by (A–C) bend angle and (D–F) maximal angular velocity. Each point represents the median of up to seven responses for an individual fish. Box plots show the group medians, upper 75% quantiles, and lower 25% quantiles. Significance was determined using Behrens-Fisher |
|
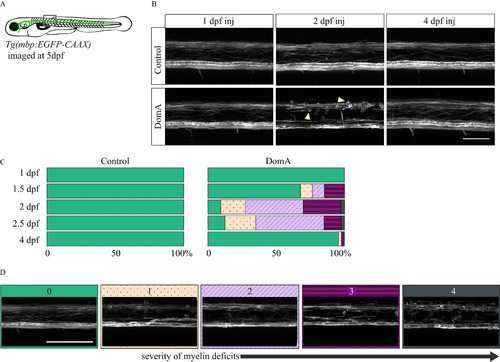
Confocal imaging of myelin sheath structures of zebrafish exposed to domoic acid (DomA) at different developmental days (A) |
|
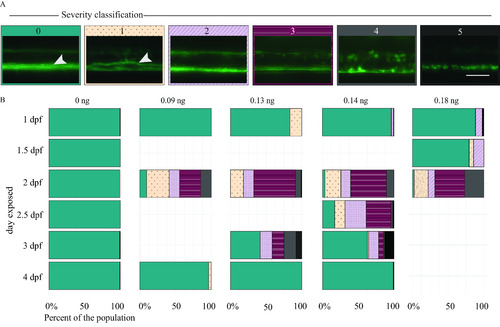
Myelin sheaths of zebrafish at 5 d postfertilization (dpf) following exposure to domoic acid (DomA) at different developmental days. (A) |
|
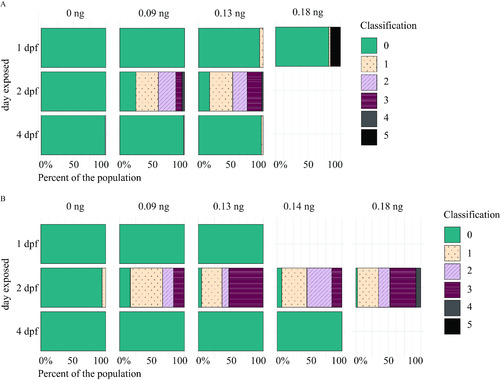
Myelin sheaths of zebrafish at 6 and 7 d postfertilization (dpf) following exposure to domoic acid (DomA) at different developmental days. |
|
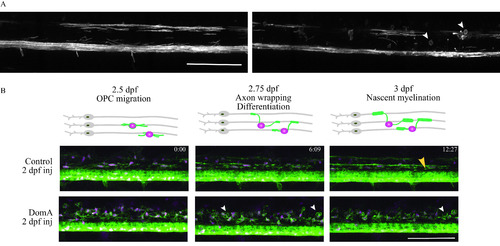
Time-lapse imaging of myelin sheath formation in zebrafish exposed to domoic acid (DomA) at 2 d postfertilization (dpf). (A) |
|
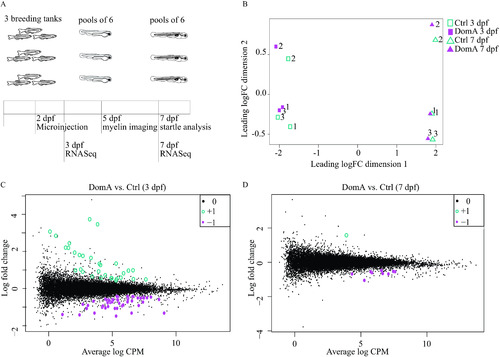
Transcriptional changes associated with domoic acid (DomA) exposure at 2 d postfertilization (dpf). (A) Experimental design. Tanks of three adult fish (2 females, 1 male) of |
|
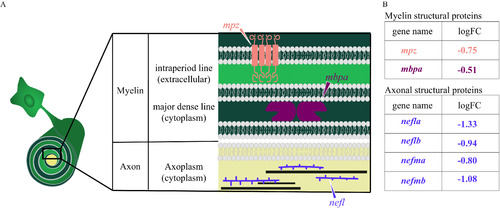
Diagram of myelin and axonal structural proteins differentially expressed in domoic acid (DomA)-exposed fish. (A) Schematic of the cross section of an axon–myelin interface with a focus on selected myelin and axon structural proteins that are differentially expressed in DomA-exposed fish at 3 d postfertilization. The magnified cross section shows the major divisions in myelin ( |

