IMAGE

Figure 6.

ID
ZDB-IMAGE-201121-163
Source
Figures for Panlilio et al., 2020
Image
Figure Caption

Figure 6.

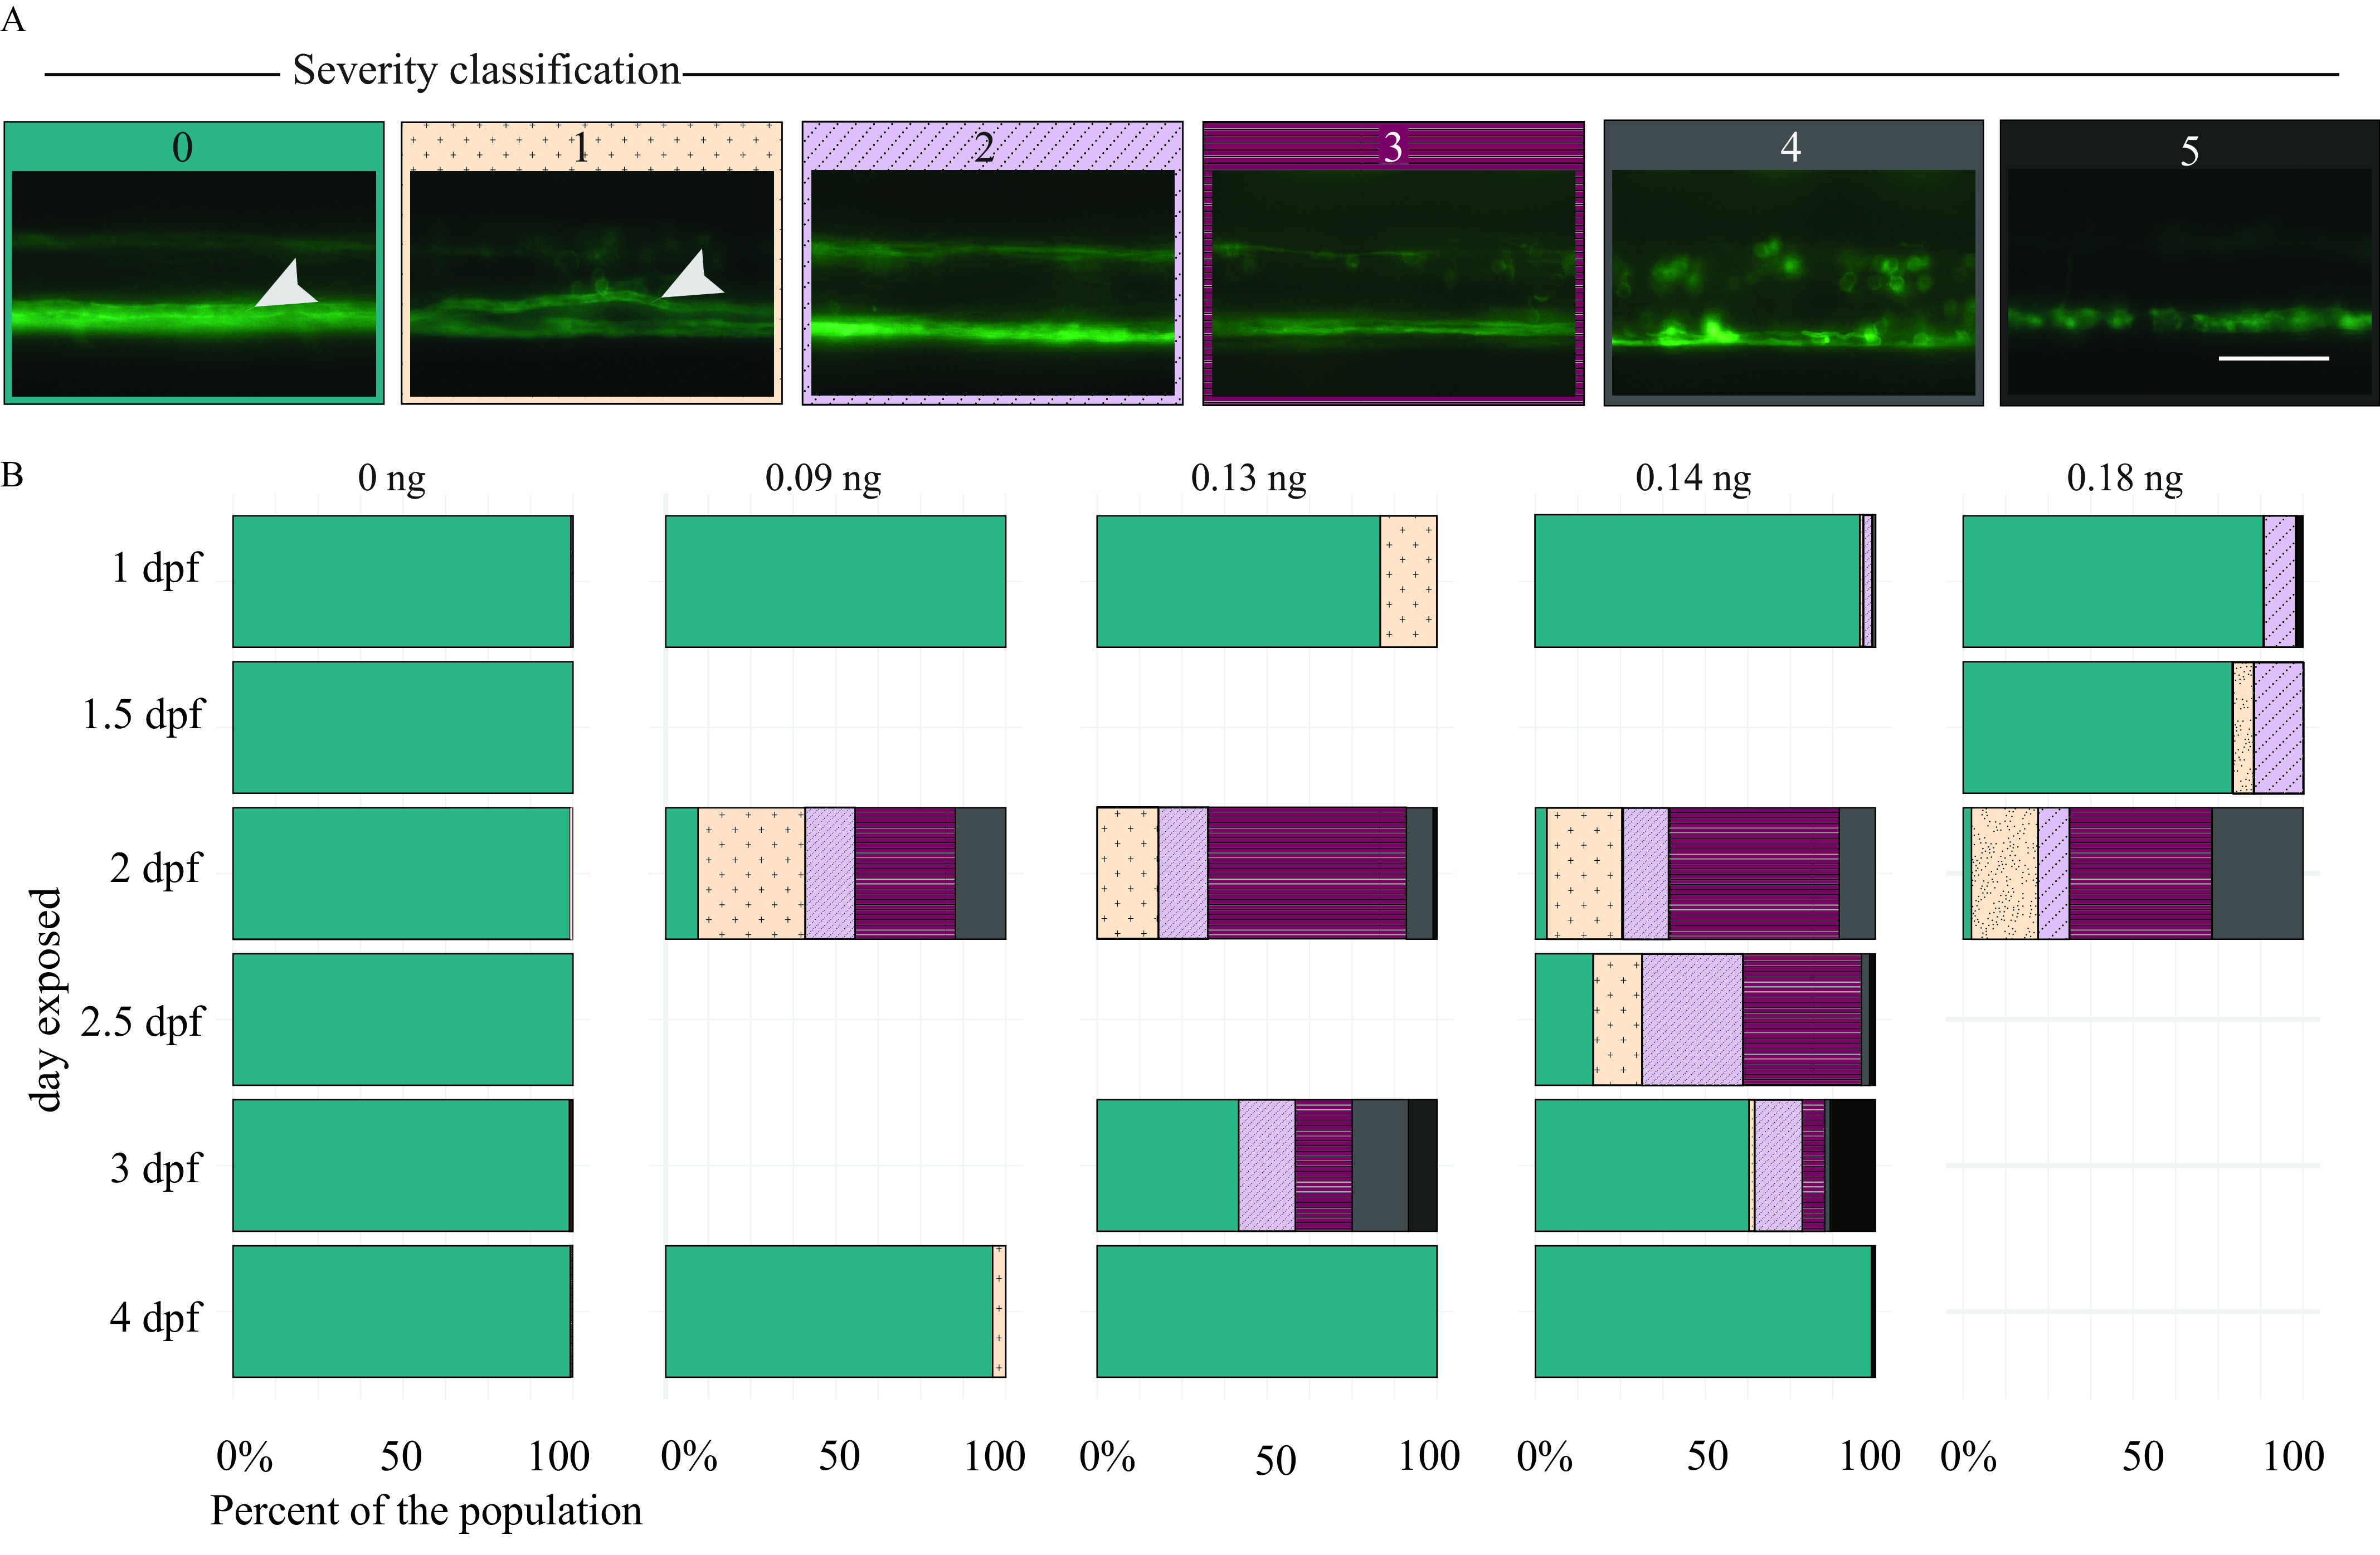
Myelin sheaths of zebrafish at 5 d postfertilization (dpf) following exposure to domoic acid (DomA) at different developmental days. (A) Tg(mbp:EGFP-CAAX) fish were exposed to DomA (0.090.18 ng) over a range of discrete developmental periods (1–4 dpf), then imaged at 5 dpf using widefield epifluorescence microscopy. Images were blindly classified into six categories based on the severity of the observed myelin phenotype. The scoring was as described in detail in Figure S2. Briefly, the classification was as follows: (0) normal phenotype, (1) myelin sheaths present but disorganized, (2) myelin with noticeable deficits, (3) myelin gaps in ventral spinal cord, (4) myelin sheaths lacking in ventral spinal cord, and (5) visible sloughed myelin. Arrows indicate the myelinated Mauthner axon that is required for short latency C-bends startle responses. (B) Stacked bar plots show the distribution of the different phenotypes. Multiple trials were combined to calculate the percentage distribution per phenotype observed. Scale bar: 50μm Table S21 includes the number of trials represented along with the associated numbers of fish per trial. Table S22 includes the myelin phenotype classification by dose and day injected. Table S24 contains the output of the multinomial logistic regression model to assess the role of developmental day of exposure on the distribution of myelin phenotypes. Table S29 contains the output of the multinomial logistic regression model for the influence of dose on the distribution of myelin phenotypes.

Acknowledgments
This image is the copyrighted work of the attributed author or publisher, and ZFIN has permission only to display this image to its users. Additional permissions should be obtained from the applicable author or publisher of the image. Full text @ Environ. Health Perspect.