FIGURE

Figure 5.

ID
ZDB-FIG-201121-161
Publication
Panlilio et al., 2020 - Developmental Neurotoxicity of the Harmful Algal Bloom Toxin Domoic Acid: Cellular and Molecular Mechanisms Underlying Altered Behavior in the Zebrafish Model
Other Figures
All Figure Page
Back to All Figure Page
Figure 5.

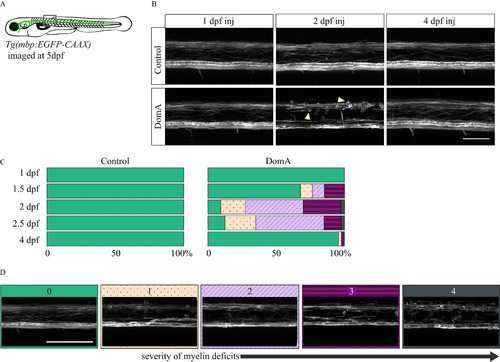
Confocal imaging of myelin sheath structures of zebrafish exposed to domoic acid (DomA) at different developmental days (A) Tg(mbp:EGFP-CAAX) fish were used to visualize labeled myelin sheaths. (B) Representative images of fish exposed to DomA (0.130.14 ng) during discrete periods in early development [1–4 d postfertilization (dpf)], then imaged at 5 dpf using confocal microscopy. Arrows indicate the unusual circular membrane profiles. (C) Stacked bar plots show the distribution of the different myelin phenotypes when fish were exposed to DomA at discrete developmental times. Multiple trials were combined to calculate the percentage distribution per phenotype observed. (D) Representative confocal microscopy images of different myelin phenotypes that were observed. Each fish was blindly classified and assigned a category based on the severity of the myelin deficit observed. The scoring was as described in detail in Figure S2. Briefly, the classification was as follows: (0) normal phenotype, (1) myelin sheaths present but disorganized, (2) myelin with noticeable deficits, (3) myelin gaps in ventral spinal cord, and (4) myelin sheaths lacking in ventral spinal cord. Scale bar: 50μm (Figure 5B) and 100μm (Figure 5D). Table S20 includes the number of trials represented along with the associated numbers of fish per trial.

Expression Data

Expression Detail
Antibody Labeling
Phenotype Data

Phenotype Detail
Acknowledgments
This image is the copyrighted work of the attributed author or publisher, and ZFIN has permission only to display this image to its users. Additional permissions should be obtained from the applicable author or publisher of the image. Full text @ Environ. Health Perspect.