
Figure 2.
- ID
- ZDB-IMAGE-201121-159
- Publication
- Panlilio et al., 2020 - Developmental Neurotoxicity of the Harmful Algal Bloom Toxin Domoic Acid: Cellular and Molecular Mechanisms Underlying Altered Behavior in the Zebrafish Model
- All Figures
- Figures for Panlilio et al., 2020
|
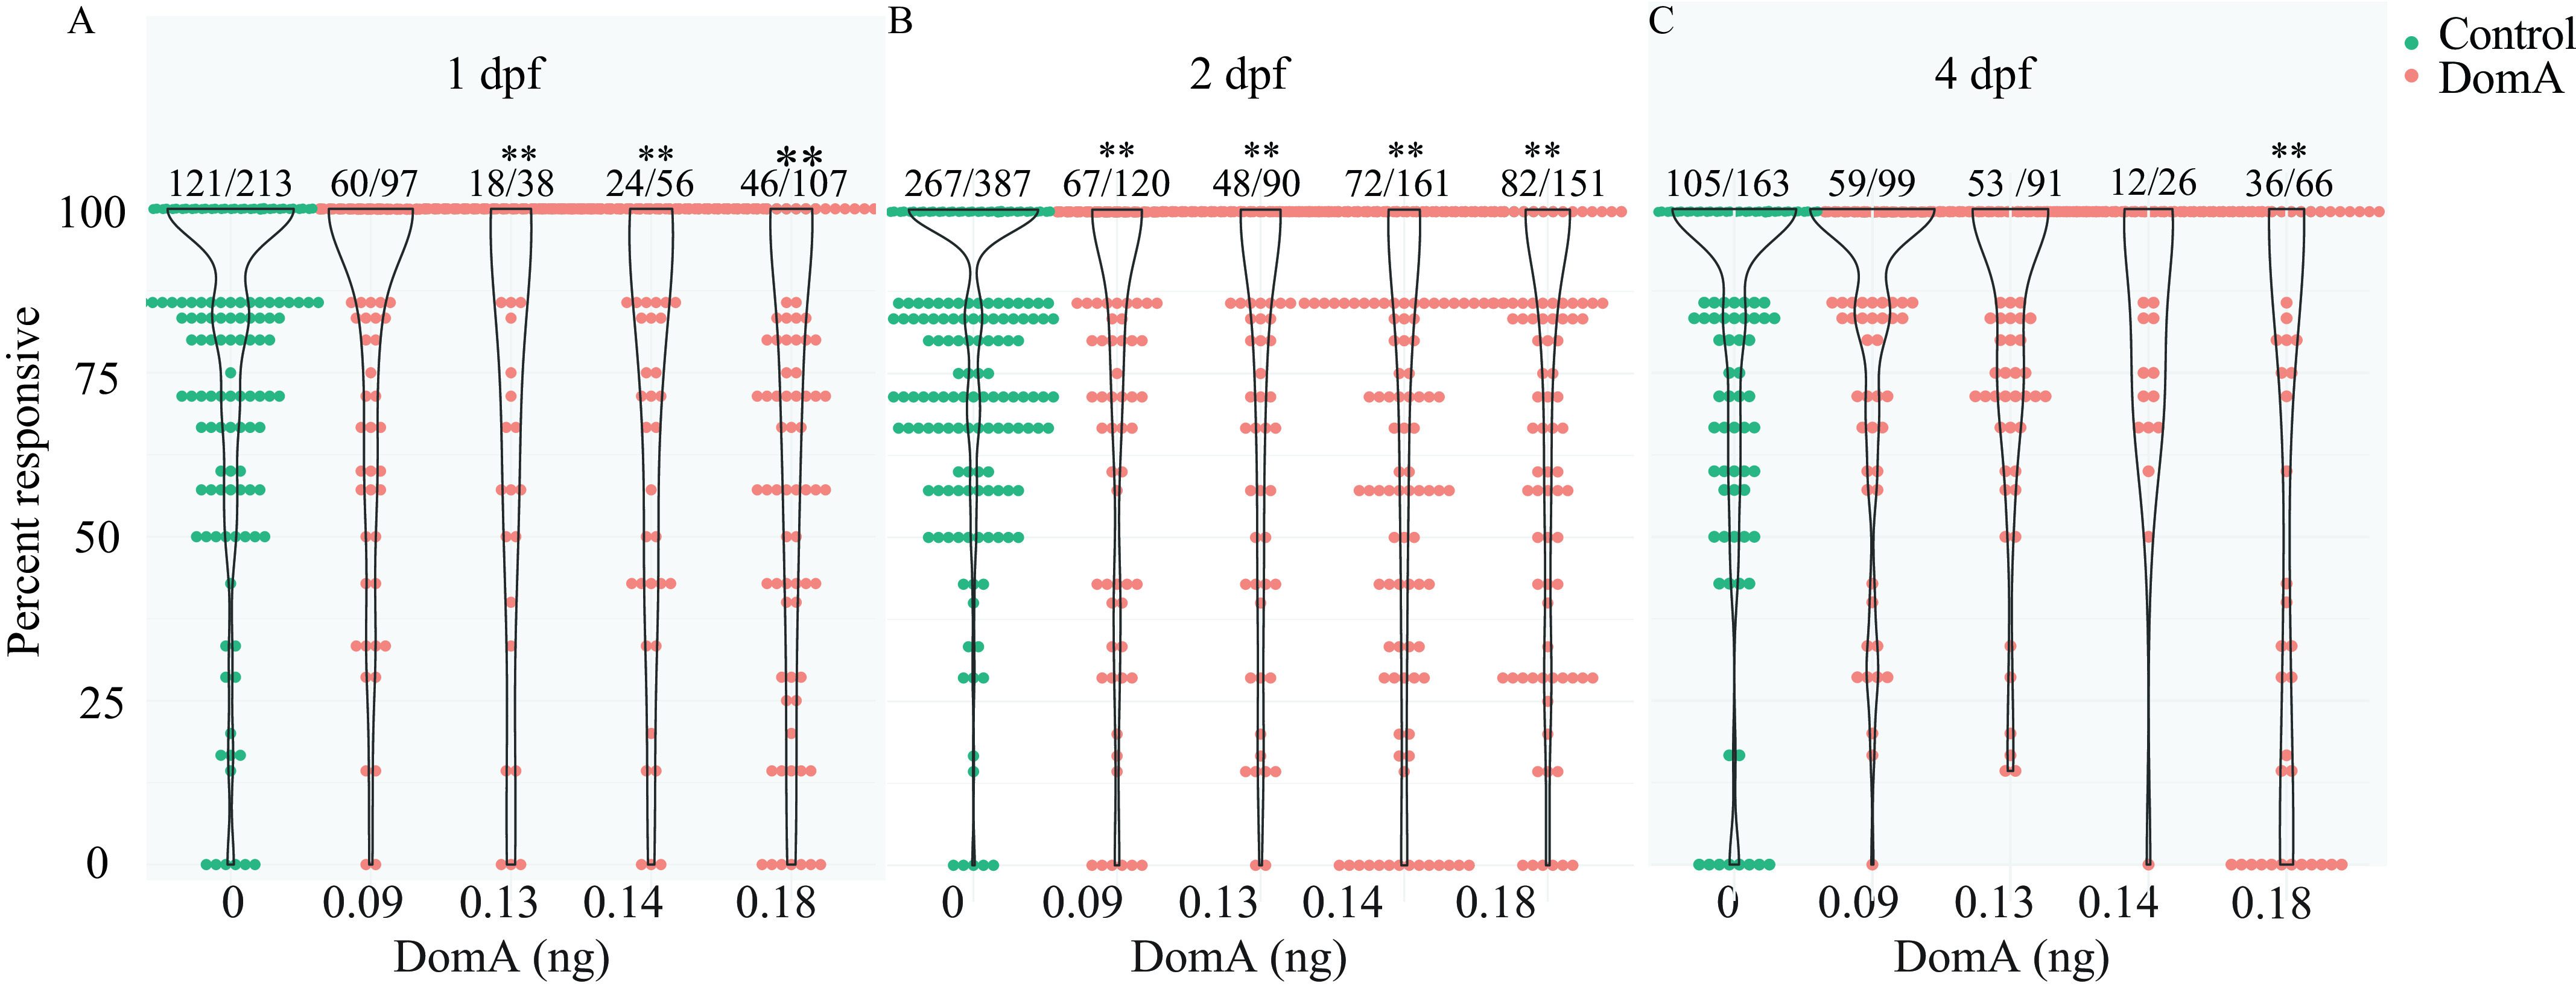
Figure 2.
Startle responsiveness in zebrafish exposed to domoic acid (DomA) at 1, 2, and 4 d postfertilization (dpf). Fish were exposed to different doses of DomA at (A) 1 dpf, (B) 2 dpf, or (C) 4 dpf, and startle responses were measured at 7 dpf. Points represent the percentage response of individual fish to replicate stimuli. Ratios listed above represent the number of fish that responded to 100% of the stimuli over the total number of fish tested per treatment group. Violin plots are overlaid to show kernel density distribution of the data. Significance was determined with post hoc pairwise Dunnett comparisons following binomial modeling of percentage responsiveness.