FIGURE SUMMARY
Title

Drainage of inflammatory macromolecules from brain to periphery targets the liver for macrophage infiltration

Authors
Yang, L., Jiménez, J.A., Earley, A.M., Hamlin, V., Kwon, V., Dixon, C.T., Shiau, C.E.
Source
Full text @ Elife

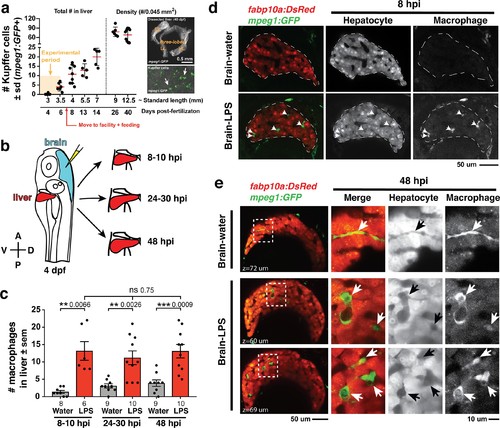
Induction of brain inflammation triggers macrophage infiltration into the liver.

(a) Time-course of Kupffer cell development. Total macrophage numbers (mpeg1:GFP+) per liver from 4 to 14 days post-fertilization (dpf) and macrophage density (number per field of view) from dissected livers at juvenile adult stages from 26 to 40 dpf. Standard length corresponding to each stage is shown. Kupffer cells are not present at four dpf at the time of brain microinjection and during most of the experimental period (orange box). Feeding began after six dpf to ensure normal animal development. Fluorescent images on the right show dissected whole liver with the typical three-lobed structure at 40 dpf (top) and high magnification of top dotted box region showing Kupffer cells (bottom). LL, Left lobe; RL, right lobe; VL, ventral lobe. (b) Schematic of brain microinjection at four dpf and analysis of the hepatic response at 8–10 hr post injection (hpi), 24–30 hpi, and 48 hpi. A, anterior; P, posterior; V, ventral; D, dorsal. (c) Quantification of macrophage infiltration in the liver comparing between LPS and control water injections in the brain at four dpf and analyzed at different timepoints. Numbers below bar graphs represent n, number of animals analyzed. (d) At eight hpi, single-plane image from a z-stack shows infiltrated macrophages (GFP+, arrows) nested between hepatocytes (DsRed+) in the liver (dotted region) after brain-LPS injection, but no macrophages observed in control brain-water injection. (e) At 48 hpi, images from two separate z-planes show an abnormally large number of macrophages in the liver that persists after brain-LPS injection (arrows), while few presumably Kupffer cells begin to appear in control brain-water injected animals at this timepoint (arrow). Two-tailed Welch’s t-test was used to determine statistical significance for each pair-wise comparison. One-way ANOVA test for comparing the three LPS injection groups. sem, standard error of means; ns, not significant; **, p<0.01; ***, p<0.001.


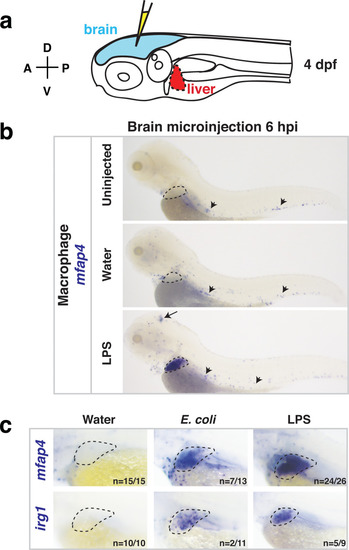
Whole-body analysis using RNA in situ hybridization shows abnormal localization of macrophages in the liver after brain injection of LPS or bacteria.

(a) Schematic showing injection of substances (yellow) in the tectum parenchyma (blue) in the four dpf zebrafish larva and subsequent analysis of the periphery that highlights the most prominent change in the liver (red). A, anterior; P, posterior; D, dorsal; V, ventral. (b) In the four dpf zebrafish, macrophages (mfap4+) are normally absent in the liver (dotted region) while sparsely spread throughout the body (arrowheads) as shown in larvae which were uninjected or water vehicle injected in the brain at six hpi. By contrast, after LPS injection in the brain, strong expression of macrophage marker mfap4 is found in the liver (dotted region), while the brain injection site is often also accompanied by a mfap4 expression increase (arrow). (c) Analysis of zebrafish macrophage-specific markers mfap4 and irg1 in the liver (dotted region) after brain injections with water vehicle, E. coli, or LPS. Results indicate that both LPS and E. coli injections induce ectopic localization of macrophages in the liver, which appear to be activated (expressing irg1) at least in a subset, but no macrophages in the liver in control animals.

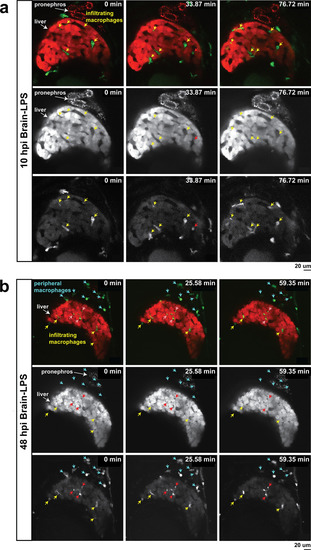
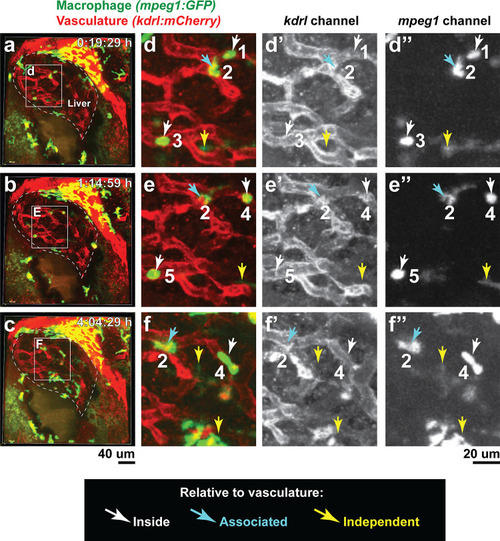
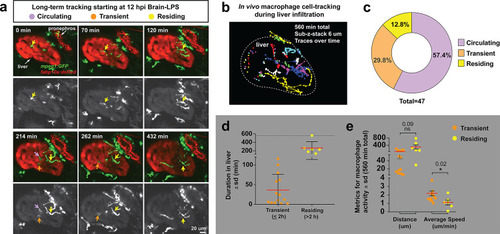
In vivo time-lapse imaging shows dynamic movements and processes of infiltrating macrophages in the liver at short- (10 hpi) and long- (48 hpi) term timepoints after brain-LPS injection.

Single slice images from z-stacks taken using a 40x objective correspond to Videos 1 and 2. (a) Representative single-slice images of three timepoints from time-lapse imaging of macrophage infiltration at 10 hr post injection of LPS in the brain. Top, merged channels of mpeg1:GFPlabeling macrophages and fabp10a:DsRed labeling hepatocytes; middle, DsRed channel showing hepatocytes and pronephros; bottom, GFP channel showing macrophages. Pronephros are labeled because the red fluorescent dextran used as a tracer for the brain injection gets into circulation and is filtered by the pronephros. (b) Representative static single-slice images of the whole liver and macrophages at 48 hpi of LPS in the brain. Yellow arrows, infiltrating macrophages; red arrow in a), circulating monocyte/macrophage; red arrow in b), macrophage with elaborate long processes intercalated between hepatocytes. Blue arrows in b), peripheral macrophages not in the liver.

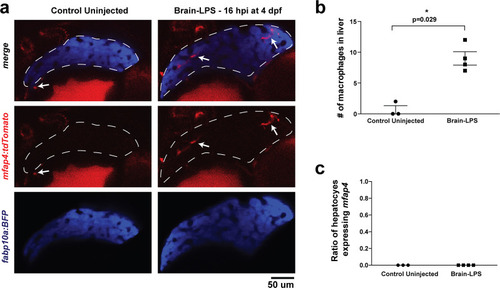
Brain-LPS injection was not found to induce mfap4 expression in the liver.

(a) Comparison between control uninjected and brain-LPS injected in double transgenic four dpf larvae was made at 16 hpi. Fluorescent reporters for liver (fabp10a:BFP) and macrophages (mfap4:tdTomato) were used for in vivo imaging to determine whether ectopic induction of mfap4 may occur in hepatocytes due to LPS activation. Representative single 2 µm z-plane images do not show ectopic expression of mfap4 other than in infiltrating macrophages in the liver (which are stereotypically located near or within liver sinusoids or gaps between hepatocytes) after LPS injection. Coinciding with a lack of macrophage infiltration in the control animals, no mfap4 expression was observed in the liver (demarcated by dotted line). (b) Scatter plot shows analysis of macrophage infiltration in the liver using the double transgenic larvae. Brain-LPS injection causes infiltration of mfap4:tdTomato expressing macrophages but not in the control uninjected animals. (c) Quantification of liver cells expressing mfap4 shows none did. Individual slices through entire z-stack of whole liver were assessed for co-expression of hepatocyte reporter with the mfap4 reporter. In all plots, each symbol represents an independent larva analyzed. Two-tailed student’s t-test was used to determine statistical significance.

Macrophages infiltrate the liver through vasculature and vasculature-independent routes.

Double transgenic zebrafish expressing the macrophage mpeg1:GFP and endothelial kdrl:mCherry reporters were used to localize infiltrating macrophages after brain-LPS injection at 8–10 hpi in the four dpf zebrafish. (a–f) Representative images corresponding to Video 3. a, b, c 3D volumetric view of whole liver (demarcated by a dotted line) and surrounding region taken from three timepoints of a confocal time-lapse imaging (see Video 3) of an 80 µm z-stack at 40x. d, e, f High magnification of the boxed region shown in the corresponding left panels. Representative infiltrating macrophages are labeled numerically 1–5 with their relative position to the vasculature: inside (white arrow), associated (blue arrow), or independent of vasculature (yellow arrow).

Long-term in vivo tracking of infiltrating macrophages shows that occupation time in the liver can be used for their classification.

(a) Representative 3D images from six timepoints corresponding to Video 4 from a four dpf zebrafish which was brain-LPS injected and imaged starting at 12 hpi. Infiltrating macrophages can be classified into three groups (examples shown by arrows of different colors): circulating (present in only a single timepoint), transient (<2 hr) and residing cell (>2 hr). Double transgenic zebrafish labeling macrophages (mpeg1:GFP) and hepatocytes (fabp10a:DsRed) were used to track macrophage infiltration over a 10 hr period. Color overlay of both channels and single GFP channel in grayscale for macrophages are shown. LPS was co-injected with Alexa 568 conjugated dextran to validate brain injections and detect systemic distribution of the injected material based on labeling of the pronephros by the fluorescent dextran. Labeling of pronephros has been previously described after intravenous injection of a fluorescent tracer (Oltrabella et al., 2015), but labeling of proximal kidney tubules can also be observed in transgenic lines expressing a red fluorescent protein. (b) 2D projection of the tracking of infiltrating macrophages in the entire liver over all timepoints of analysis. Each traced cell is represented by a circle for its location at each timepoint if present in the liver, and a line for its movement between the timepoints. Different colors represent different cells. (c) Relative percentage of the different types of infiltrating macrophages based on liver occupation. n = 47 macrophages were tracked and analyzed. (d) Scatter plot shows the total duration of each traced infiltrating macrophage in the ‘transient’ and ‘residing’ groups. (e) Total distance and average speed of each macrophage in the ‘transient’ and ‘residing’ groups. Total distance was not significantly different, but the ‘transient’ macrophages moved faster with a significantly higher average speed than the ‘residing’ cells. sd, standard deviation; ns, not significant.

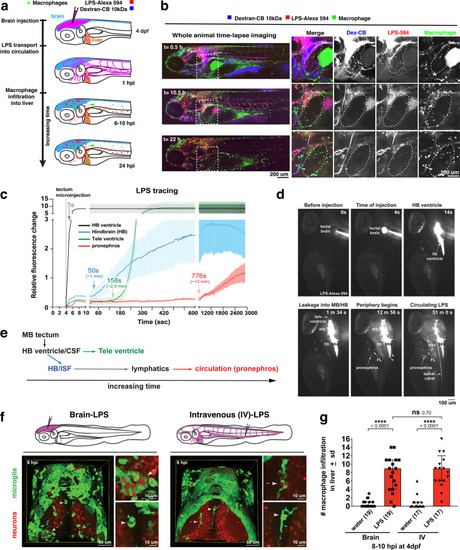
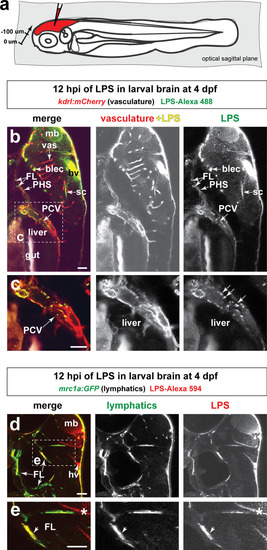
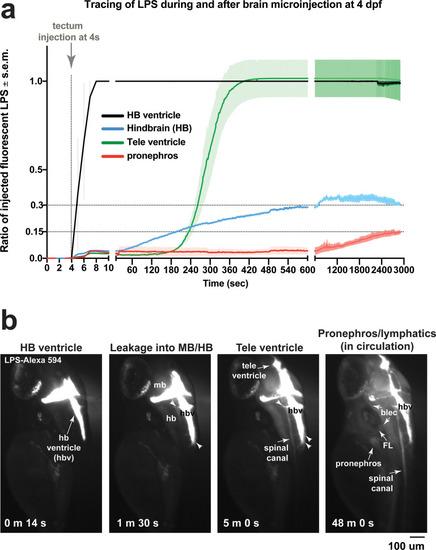
Brain-LPS microinjection leads to drainage of LPS molecules into circulation, and causes a hepatic response similar to intravenous LPS injection.

(a) Schematic showing time-course of LPS and macrophage distribution. Fluorescently Alexa 594 tagged LPS shown in red, co-tracer dextran-cascade blue shown in blue, and detection of both is shown in magenta. (b) Left, representative 3D images from three timepoints of a 24-hour time-lapse imaging of a large frame stitched from four z-stack tiles (corresponding to Video 5). Right, high magnification of the 3D images in dotted box region on the left panel showing liver (dotted region) and surrounding area. Merged overlays and individual channels showing Dex-CB (blue), LPS-594 (red), and macrophages (mpeg1:GFP+). (c) Live recording of the brain microinjection at four dpf using Alexa 594 or Alexa 488 conjugated LPS was conducted to trace the distribution of LPS in real time at 1 frame per second using an automated acquisition software on a Leica M165 FC stereomicroscope with a high speed and high sensitivity deep-cooled sCMOS camera (DFC9000 GT). Kinetic time plot of relative fluorescence change ± sem of fluorescently tagged LPS starting before the injection at 0 seconds; data from three independent injected animals were used to generate plot. Time of injection was at the 4 seconds timepoint. Arrows indicate the timepoint at which initial LPS signals were detected in the corresponding anatomical location. In some injected animals, LPS also flowed anteriorly from the midbrain ventricle into the telencephalon ventricle starting at about 2.5 minutes after injection (see Figure 2—figure supplement 3). (d) Still images representing key events of the dispersion of LPS starting from before to nearly 1 hour after the brain microinjection corresponding to Video 7. hb, hindbrain; tele, telencephalon; hbv, hindbrain ventricle; mb, midbrain; FL, facial lymphatics; blec, brain lymphatic endothelial cells; CSF, cerebrospinal fluid; ISF, interstitial fluid. (e) Schematic showing the major route through which LPS were transferred from the site of brain microinjection to peripheral circulation. (f) Top, illustration of brain and intravenous LPS injections. Bottom, 3D tectum brain volume from confocal live imaging at four dpf at 6 hours after brain or intravenous LPS injection using a 40x objective. Microglia (mpeg1:GFP+) and surrounding neurons (nbt:DsRed+) shown. Small panels show high magnification of microglia (arrows) and neurons corresponding to arrows in the large 3D brain volume image on the left. LPS injection in the brain led to a striking morphological activation of rounded and clustering microglia (arrows), but not by intravenous injection of LPS at 6 hpi. Superficial planes of the head are eliminated to allow visualization of the internal microglia, because the cranial skin surface is highly auto-fluorescent in the GFP channel. (g) Quantification of macrophage infiltration at 8-10 hpi in the four dpf zebrafish larvae. Two-tailed Welch’s t-test was used to determine statistical significance. sd, standard deviation; ns, not significant; ****, p<0.0001; LPS-594, LPS-Alexa 594; Dex-CB, cascade blue conjugated dextran, sem, standard error of means. Numbers in parenthesis represent n, number of animals analyzed.

Injected LPS macromolecules disperse from the hindbrain ventricle into the hindbrain and spinal cord/trunk interstitial spaces and are localized within the head and trunk lymphatics.

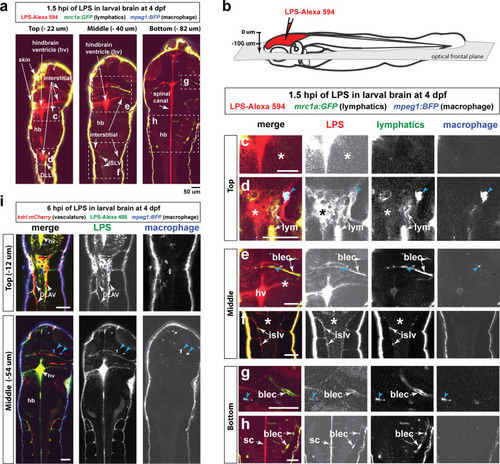
Wild-type double transgenic zebrafish at four dpf were microinjected with fluorescently tagged LPS in the tectal brain. To localize the LPS relative to the lymphatic and vasculature structures, two transgenes were used: mrc1a:GFP (Jung et al., 2017) and kdrl:mCherry (Fujita et al., 2011), respectively. Since mrc1a:GFP is known to also be expressed by macrophages (Jung et al., 2017), we generated a new macrophage reporter (mpeg1:BFP) to provide a third channel in blue to distinguish lymphatic from macrophage expressions. Blue arrows point to microglia/macrophage. (a) Three multi-tiled representative frontal plane optical slices from an in vivo confocal z-stack at 1.5 hpi show top, middle, and bottom sections through the head and anterior trunk of the LPS-injected animal. (b) Schematic of the frontal plane optical sections imaged. (c, d) High magnification images corresponding to dotted region in top slice in a). Most superficial layer of the CNS where LPS (red) is concentrated in the hindbrain ventricle and adjacent interstitial parenchymal space (c, asterisk) as well as the most-dorsal junction of the hindbrain-spinal cord (d, asterisk). (e, f) High magnification images of dotted region in middle slice shown in a). LPS is found localized to the lymphatic structures (blec and islv), and abundant in the interstitial space extending from the hindbrain ventricle (asterisk). (g,h) High magnification images corresponding to bottom slice in a). LPS is highly abundant in the spinal canal (sc) as well as tectal and hindbrain lymphatic cells (blec). (i) Top and middle slices of a different LPS-injected animal show the same distribution of LPS at 1.5 hpi. LPS does not appear to localize within the blood vasculature in the CNS or trunk to the same extent as it overlaps with the lymphatic cells. Top slice shows vasculature DLAV surrounded by but not overlap with LPS, arrows. *, interstitial space; DLAV, dorsal longitudinal anastomotic vessels; DLLV, dorsal longitudinal lymphatic vessel; blec, brain lymphatic endothelial cells; islv, intersomitic lymphatic vessels; sc, spinal canal; hv, hindbrain ventricle; hb, hindbrain; lym, lymphatics. Skin is highly auto-fluorescent and labeled by all channels at the border of every tissue. Scale bars all show 50 µm.

Injected LPS macromolecules into tectal brain results in distribution of LPS within the facial lymphatic network and peripheral vasculature.

(a) Schematic of the sagittal optical planes taken by in vivo multi-tiled z-stack confocal imaging. (b) Whole-mount side view of a representative LPS-injected four dpf larvae carrying the vasculature reporter kdrl:mCherry at 12 hpi showing LPS strongly retained in the hindbrain ventricle (hv) and surrounding brain interstitial space as well as the brain and facial lymphatics (blec and FL, arrows) and the peripheral vasculature (PCV and PHS, arrows), but not in the brain blood vessels (vas). (c) High magnification of dotted region in b) showing uptake of LPS as fluorescent puncta (arrows) by the PCV, but LPS is absent in the hepatic region. (d) Characterization of the same timepoint at 12 hpi as in b–c) using fish carrying the lymphatic reporter clearly show localization of LPS within the facial lymphatics (FL, arrows). By stark contrast, LPS is not localized to the brain vessels, thereby providing evidence for drainage of LPS from brain to peripheral circulation through the lymphatics via the interstitial fluid. (e) Higher magnification of dotted box region in d). FL, facial lymphatics; PHS, primary head sinus; PCV, posterior cardinal vein; blec, brain lymphatic endothelial cells; sc, spinal canal; hv, hindbrain ventricle; vas, brain vessels; mb, midbrain; *, interstitial space. Scale bars all show 50 µm.

Microinjection of fluorescent LPS into brain tectum at four dpf results in low LPS transfer from hindbrain ventricle into brain interstitial space at around 30% and into the periphery at less than 15% of injected LPS level.

(a) Time plot showing LPS level changes in different regions as a ratio of injected fluorescent LPS. Injected LPS level was determined by the relative saturation level of fluorescence in the hindbrain ventricle as it is the immediate site filled in by LPS at time of injection. Both hindbrain and telencephalon ventricles reach 100% maximum LPS level based on fluorescence, while hindbrain interstitial space reaches around 30% of maximum and the periphery based on accumulation in the pronephros as a proxy reaches less than 15% of maximum. This plot illustrates a small fraction of maximum LPS that does get passed onto the periphery. Plot shows average and s.e.m. (standard error of means) of data from three independent LPS-injected animals. See Figure 2 for related analysis of tracing LPS from brain microinjection. (b) Still images of key events from tracing LPS-Alexa 594 after brain injection by high-resolution time-lapse stereomicroscopy, taken from a different LPS-injected animal than the example shown in Figure 2. Injection occurred at the 4s timepoint. Some injected animals such as this one, LPS is detected to also move anteriorly from midbrain/hindbrain ventricle into telencephalon ventricle. By 48 min post injection, we detected broad distribution of LPS in circulation at a low intensity. FL, facial lymphatics; blec, brain lymphatic endothelial cells; hbv, hindbrain ventricle; mb, midbrain; hb, hindbrain; tele, telencephalon; m, minute; s, second.

Blocking circulation by a morpholino-mediated <italic>tnnt2</italic> knockdown prevented macrophage infiltration into the liver 8 hr after brain injection with LPS.

(a) Representative 3D volumetric and single z-plane images shown for after LPS or water vehicle injection in the brain. Dotted region shows liver in the single channel panels. Transgenes fabp10a:DsRed and mpeg1:GFP were used to label hepatocytes and macrophages, respectively. (b) Quantification of the number of macrophages found in the liver at 8hpi in four dpf zebrafish. No difference was found between the control and LPS injected groups as they both lacked macrophage infiltration. Each symbol represents an independent animal. Statistical test was determined by a two-tailed t-test. ns, not significant; MO, morpholino.

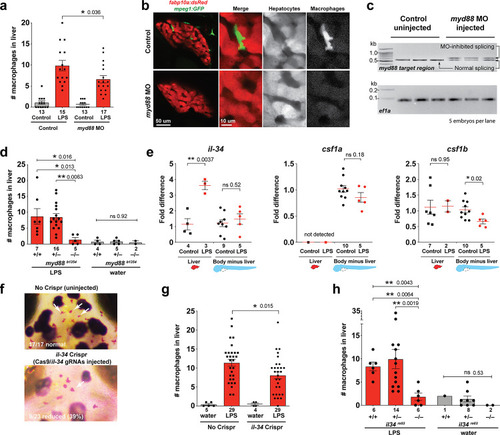
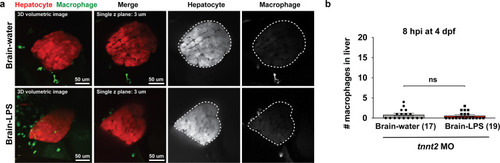
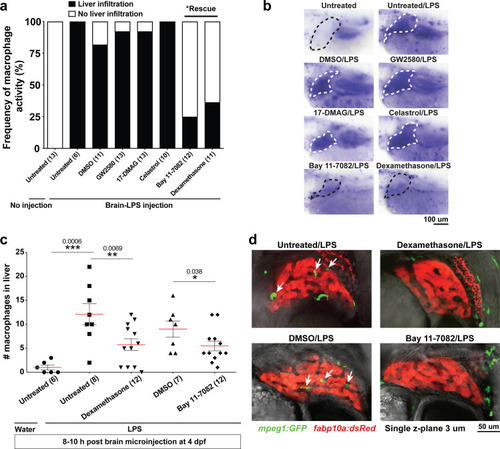
Infiltration of liver by macrophages triggered by brain-LPS injection is dependent on adaptor protein myd88 and cytokine il-34.

(a) Quantification of macrophage infiltration 6 hr after brain-LPS injection or control treatment (brain-water injection and no injection combined) in myd88-deficient morpholino-injected animals compared with control wild-type siblings at four dpf. (b) Left column, representative single plane of whole liver (DsRed+) showing macrophage infiltration (GFP+) in the control animal but not in the myd88 morpholino-injected animals. Second to fourth columns, high magnification of the merged overlay and single channels showing a single macrophage (GFP+) stationed between hepatocytes (DsRed+) in control but not in myd88 morpholino-injected animals. (c) RT-PCR analysis showing efficacy of myd88 morpholino in blocking normal myd88splicing at three dpf. Elongation factor one alpha (ef1a) PCR used as a sample quality control. (d) Complementary experiments using myd88 mutants derived from a heterozygous incross show either few or no macrophages in the liver after brain-LPS injection at 16–24 hpi similar to baseline brain-water injected animals, demonstrating a much stronger effect in reversing macrophage infiltration than the partial myd88 knockdown by morpholinos. (e) qPCR analysis of il-34, csf1a, and csf1b expression in liver only and body-minus-liver tissues comparing brain-LPS injected animals with the control group (brain-water injected and uninjected animals combined) at 6 hpi in four dpf zebrafish. (f) Representative images of control (top) and il-34 F0 Crispr-injected (bottom). Microglia reduction observed in transient il-34 F0 Crispr-injected animals shown by neutral red staining (microglia, white arrows), phenocopying previously described stable il-34 mutants (Kuil et al., 2019). (g) Quantification of macrophage infiltration indicates a significant reduction at 8–10 hpi in four dpf transient il-34 deficient F0 Crispr-injected animals. (h) Stable il34 mutants derived from a heterozygous incross show either few or no macrophages in the liver after brain-LPS injection at 16–24 hpi similar to baseline brain-water injected animals, showing a much stronger effect in eliminating macrophage infiltration than in the partial gene knockout in transient il-34 F0 Crispr-injected animals. Statistical significance was determined by a two-tailed t-test coupled with a F-test validating equal variances for two-way comparisons, and Kruskal-Wallis multiple comparisons test for three-way comparisons in d and h (shown by the top bar) followed by corrected two-way tests if the multiple comparisons test was significant. *, p<0.05; **, p<0.01; ns, not significant; data points in scatter plots represent n, independent biological samples or animals. Numbers below bar graphs represent n.

Anti-inflammatory drugs dexamethasone and Bay 11–7082 were effective for preventing liver infiltration by macrophages after brain-LPS injection.

(a) Frequency of liver infiltration at 8–10 hr after brain-LPS injection showed that only Bay 11–7082 (1 µM) and dexamethasone (6.5 µM) treatments were effective for preventing macrophages from infiltrating the liver as determined by in situ hybridization. Number of independent animals as shown in the parenthesis. (b) Representative whole-mount RNA hybridization for macrophage marker mfap4 showing liver in the dotted region. White dotted liver indicates infiltration, while black dotted liver shows no infiltration. (c) Quantification of the number of infiltrating macrophages either after water or LPS injection in the brain in the control or drug treated conditions as determined by in vivo imaging. (d) Representative single z-plane images from z-stacks that show abundant infiltrating macrophages (arrows) in control treated animals after brain-LPS injection, but no infiltration in dexamethasone or Bay 11–7082 treated larvae. Student’s t-test was used to determine statistical significance.

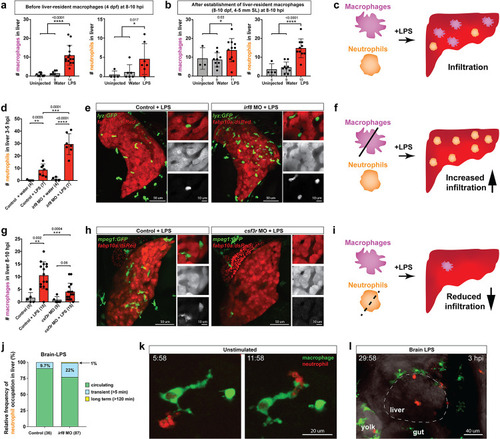
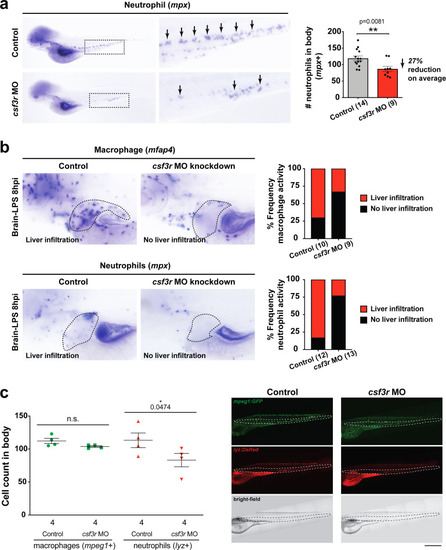
Neutrophils and macrophages coordinate to infiltrate the liver during a systemic inflammatory response.

(a–b) Total count of macrophages or neutrophils in liver in control (uninjected and brain-water injected) or brain-LPS challenged animals before and after development of liver-resident macrophages (Kupffer cells) at four dpf and 8–10 dpf, respectively. (c) Diagram showing typical immune infiltration after LPS addition in wild-type animals. (d-e) Effects of macrophage ablation by irf8 knockdown on neutrophil numbers in the liver 3.5–5 hr after brain-LPS injection at four dpf. (d) Quantification of neutrophil numbers. (e) Confocal 3D volume imaging of the whole liver with high magnification of a small region shown on the right that is showing a single z-plane image: top, merged channels; middle, hepatocytes (DsRed+); and bottom, neutrophils (GFP+). (f) Diagram summarizing the effect of macrophage ablation on causing an increase in neutrophil infiltration after LPS injection. (g–h) Depletion of neutrophils using the csf3r morpholino reduced macrophage infiltration compared with control LPS injections 8–10 hpi at four dpf. (g) Quantification of macrophage numbers. Significantly fewer macrophages were observed in the liver after neutrophil ablation in brain-LPS injected animals. (h) Same format of images as in e. (i) Diagram summarizing the effect of neutrophil reduction. (j) Comparison of relative frequency of each type of neutrophil occupation in the liver with normal (Control) or depleted (irf8 MO-injected) levels of macrophages after brain-LPS injection, as determined by in vivo time-lapse imaging. (k) Representative 3D images of normal macrophage and neutrophil interactions around the liver at four dpf (corresponding to Video 9). (l) 3D image of macrophage and neutrophil interactions after brain-LPS injection at three hpi in the four dpf larvae showing entry of neutrophils into liver prior to macrophages (corresponding to Video 8). Statistical significance was determined by a two-tailed t-test and with Welch’s correction for unequal variances as determined by a F-test. MO, morpholino. Each data point in scatter plots represents an independent animal; n, number of animals analyzed is shown below each bar graph. Transgenes used: mpeg1:GFP for macrophages, lyz:GFP for neutrophils, and fabp10a:DsRed for hepatocytes.

Hepatic response to brain-LPS challenge still evident after establishment of Kupffer cells and adult vasculature/brain structures in juvenile adults.

(a) Live ex vivo imaging of dissected liver from juvenile adult zebrafish after microinjection of either water vehicle or LPS in the brain at 16–18 hpi. Top, arrows point to macrophages in liver using the mpeg1:GFP transgene. Bottom, arrows point to neutrophils in the liver using the lyz:mCherry transgene. (b) Quantification of macrophage density (# mpeg1:GFP+ cell per field of view, FOV). (c) Quantification of neutrophil density (# lyz:mCherry+ cell per FOV). Scatter plots show uninjected controls, or animals microinjected with water vehicle or LPS in the brain. Each field of view (FOV) equals 0.045 squared mm. Statistical significance was determined by a two-tailed Student’s t-test.

Clodronate-mediated macrophage depletion results in an increase in neutrophil infiltration after brain-LPS injection.

(a) Schematic illustrating the method. Intravenous injection of clodronate liposome was performed at three dpf to allow time for the clodronate to effectively induce cell death to most macrophages over a 48 hr period. (b) Assessment of macrophage depletion by neutral red staining shows that most animals injected with clodronate liposome indeed resulted in an apparent loss of macrophages in the brain (58%, n = 12). Arrows point to microglia in the ‘no depletion’ category. (c) Scatter plot shows number of neutrophils infiltrating the liver to be even more increased after macrophage ablation in response to brain-LPS injection. Since clodronate based macrophage depletion is effective only in a proportion of the animals injected, we also used the cluster of the largest numbers of infiltrating neutrophils as a subset to show the animals with the most significant increase. (d) 3D volumetric view of the whole liver from imaging transgenic reporters fabp10a:DsRed for hepatocytes and lyz:GFP for neutrophils. Left, merged channels. Middle, DsRed channel. Right, GFP channel. Brain-water sample is shown 60 µm beneath the first surface of the liver, and the brain-LPS sample is 45 µm below the most outer liver surface. Significantly higher number of neutrophils (arrows) is easily visualized in the brain-LPS sample. Dextran-Alexa 488 was co-injected into the brain as a tracer to validate injections, and can be seen labeling the pronephros in the GFP channel. Statistical significance was determined by a two-tailed t-test and with Welch’s correction for unequal variances as determined by a F-test.

CSF3R/GCSFR knockdown was effective in reducing neutrophils for revealing neutrophil effects on macrophages.

(a) csf3r morpholino-injected animals have less neutrophils (arrows) compared with controls as assessed by RNA in situ hybridization for a neutrophil marker myeloid-specific peroxidase mpx. Right bar graph, quantification of the area of mpx expression in the body posterior to the head using ImageJ show an average of a 27% reduction. Statistical significance was determined by a two-tailed t-test with Welch’s correction. (b) Reduction of neutrophils leads to a decrease in macrophage infiltration as assessed by RNA in situ hybridization as an alternative approach in addition to live transgenic imaging as shown in Figure 4. As a control, we also verified the level of neutrophil reduction in csf3r morpholino-injected animals by mpx in situ. Right bar graphs show frequency of liver infiltration by each myeloid cell type. N is shown in parenthesis and represents number of independent animals analyzed. (c) Left, scatter plot representing the effects of csf3r morpholino-mediated knockdown on macrophages and neutrophils showed no significant change to overall macrophage numbers, but a significant reduction in neutrophils in csf3r morpholino-injected animals. In vivo confocal imaging of double transgenic zebrafish carrying the macrophage reporter (mpeg1:GFP) and the neutrophil reporter (lyz:mCherry) was conducted. Right, representative fluorescent maximum projection, multi-tiled images of the transgenic zebrafish body. Dotted region shows area of cell number quantification. Statistical significance was determined by a one-tailed t-test. Each symbol represents an individual larva. Scale bar represents 500 µm. ns, not significant.

Depleting myeloid leukocytes to prevent immune cell infiltration in liver leads to an increase in liver growth during an inflammatory response.

(a) Scattered dot and bar plot shows after brain-LPS injection, a relative liver size decrease in baseline and in control-p53-MO injected wild-type animals, whereas a significant increase in relative liver size in myeloid-depleted pu.1 morpholino-injected animals. Liver size was calculated based on changes in whole liver volume relative to the water-injected controls in each group. Each dot represents an individual larva analyzed. (b) Representative 3D rendered volumetric images of the whole liver from all groups and conditions analyzed. Statistical significance was determined by a two-tailed t-test for pair-wise comparison, and one-way ANOVA with Brown-Forsythe correction for the three-way comparisons. All scale bars represent 50 µm.

Acknowledgments
This image is the copyrighted work of the attributed author or publisher, and ZFIN has permission only to display this image to its users. Additional permissions should be obtained from the applicable author or publisher of the image. Full text @ Elife