
|
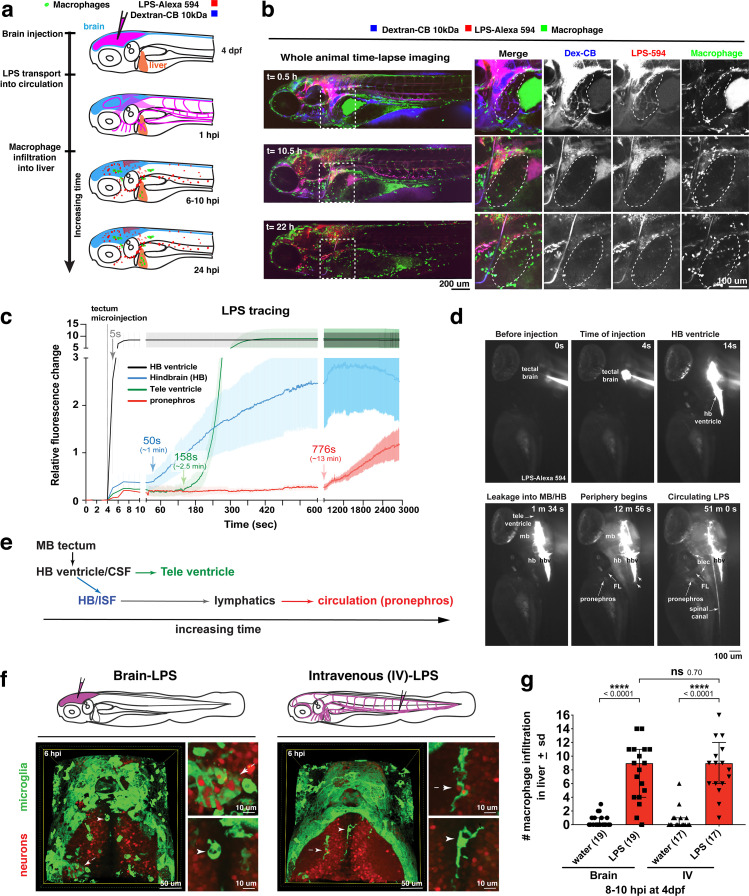
Figure 2
Brain-LPS microinjection leads to drainage of LPS molecules into circulation, and causes a hepatic response similar to intravenous LPS injection.
(a) Schematic showing time-course of LPS and macrophage distribution. Fluorescently Alexa 594 tagged LPS shown in red, co-tracer dextran-cascade blue shown in blue, and detection of both is shown in magenta. (b) Left, representative 3D images from three timepoints of a 24-hour time-lapse imaging of a large frame stitched from four z-stack tiles (corresponding to Video 5). Right, high magnification of the 3D images in dotted box region on the left panel showing liver (dotted region) and surrounding area. Merged overlays and individual channels showing Dex-CB (blue), LPS-594 (red), and macrophages (mpeg1:GFP+). (c) Live recording of the brain microinjection at four dpf using Alexa 594 or Alexa 488 conjugated LPS was conducted to trace the distribution of LPS in real time at 1 frame per second using an automated acquisition software on a Leica M165 FC stereomicroscope with a high speed and high sensitivity deep-cooled sCMOS camera (DFC9000 GT). Kinetic time plot of relative fluorescence change ± sem of fluorescently tagged LPS starting before the injection at 0 seconds; data from three independent injected animals were used to generate plot. Time of injection was at the 4 seconds timepoint. Arrows indicate the timepoint at which initial LPS signals were detected in the corresponding anatomical location. In some injected animals, LPS also flowed anteriorly from the midbrain ventricle into the telencephalon ventricle starting at about 2.5 minutes after injection (see Figure 2—figure supplement 3). (d) Still images representing key events of the dispersion of LPS starting from before to nearly 1 hour after the brain microinjection corresponding to Video 7. hb, hindbrain; tele, telencephalon; hbv, hindbrain ventricle; mb, midbrain; FL, facial lymphatics; blec, brain lymphatic endothelial cells; CSF, cerebrospinal fluid; ISF, interstitial fluid. (e) Schematic showing the major route through which LPS were transferred from the site of brain microinjection to peripheral circulation. (f) Top, illustration of brain and intravenous LPS injections. Bottom, 3D tectum brain volume from confocal live imaging at four dpf at 6 hours after brain or intravenous LPS injection using a 40x objective. Microglia (mpeg1:GFP+) and surrounding neurons (nbt:DsRed+) shown. Small panels show high magnification of microglia (arrows) and neurons corresponding to arrows in the large 3D brain volume image on the left. LPS injection in the brain led to a striking morphological activation of rounded and clustering microglia (arrows), but not by intravenous injection of LPS at 6 hpi. Superficial planes of the head are eliminated to allow visualization of the internal microglia, because the cranial skin surface is highly auto-fluorescent in the GFP channel. (g) Quantification of macrophage infiltration at 8-10 hpi in the four dpf zebrafish larvae. Two-tailed Welch’s t-test was used to determine statistical significance. sd, standard deviation; ns, not significant; ****, p<0.0001; LPS-594, LPS-Alexa 594; Dex-CB, cascade blue conjugated dextran, sem, standard error of means. Numbers in parenthesis represent n, number of animals analyzed.