IMAGE

Figure 1-S4

ID
ZDB-IMAGE-200822-15
Source
Figures for Yang et al., 2020
Image
Figure Caption

Figure 1-S4 Macrophages infiltrate the liver through vasculature and vasculature-independent routes.

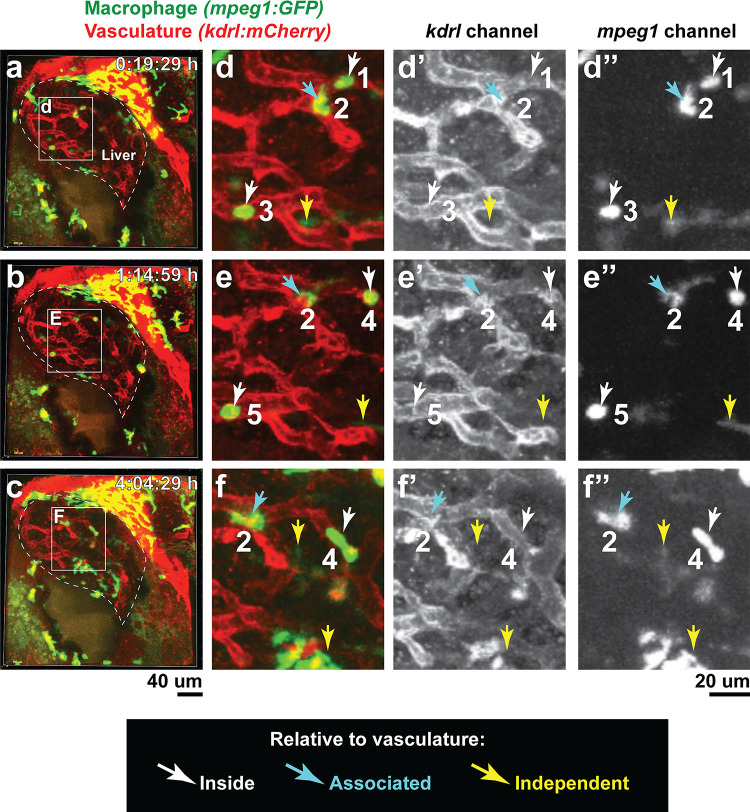
Double transgenic zebrafish expressing the macrophage mpeg1:GFP and endothelial kdrl:mCherry reporters were used to localize infiltrating macrophages after brain-LPS injection at 8–10 hpi in the four dpf zebrafish. (a–f) Representative images corresponding to Video 3. a, b, c 3D volumetric view of whole liver (demarcated by a dotted line) and surrounding region taken from three timepoints of a confocal time-lapse imaging (see Video 3) of an 80 µm z-stack at 40x. d, e, f High magnification of the boxed region shown in the corresponding left panels. Representative infiltrating macrophages are labeled numerically 1–5 with their relative position to the vasculature: inside (white arrow), associated (blue arrow), or independent of vasculature (yellow arrow).

Acknowledgments
This image is the copyrighted work of the attributed author or publisher, and ZFIN has permission only to display this image to its users. Additional permissions should be obtained from the applicable author or publisher of the image. Full text @ Elife