
|
Figure 4
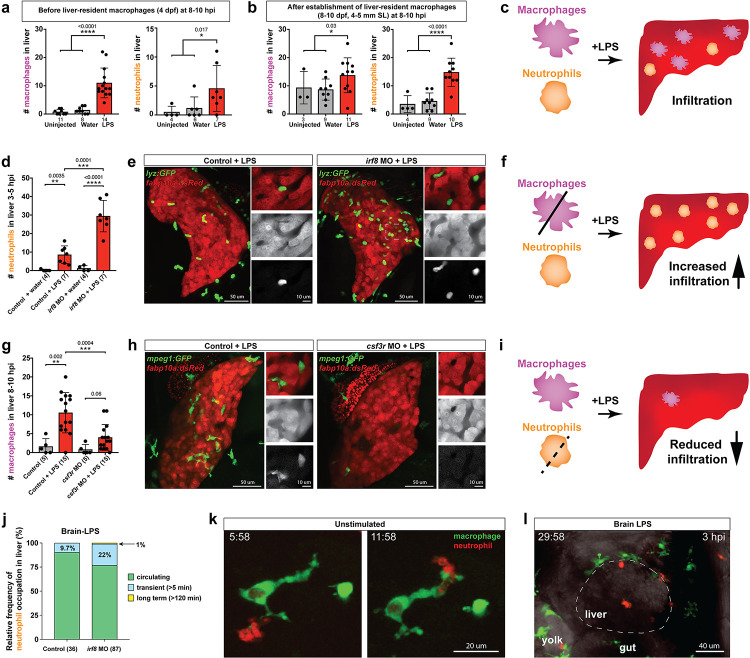
Neutrophils and macrophages coordinate to infiltrate the liver during a systemic inflammatory response.
(a–b) Total count of macrophages or neutrophils in liver in control (uninjected and brain-water injected) or brain-LPS challenged animals before and after development of liver-resident macrophages (Kupffer cells) at four dpf and 8–10 dpf, respectively. (c) Diagram showing typical immune infiltration after LPS addition in wild-type animals. (d-e) Effects of macrophage ablation by irf8 knockdown on neutrophil numbers in the liver 3.5–5 hr after brain-LPS injection at four dpf. (d) Quantification of neutrophil numbers. (e) Confocal 3D volume imaging of the whole liver with high magnification of a small region shown on the right that is showing a single z-plane image: top, merged channels; middle, hepatocytes (DsRed+); and bottom, neutrophils (GFP+). (f) Diagram summarizing the effect of macrophage ablation on causing an increase in neutrophil infiltration after LPS injection. (g–h) Depletion of neutrophils using the csf3r morpholino reduced macrophage infiltration compared with control LPS injections 8–10 hpi at four dpf. (g) Quantification of macrophage numbers. Significantly fewer macrophages were observed in the liver after neutrophil ablation in brain-LPS injected animals. (h) Same format of images as in e. (i) Diagram summarizing the effect of neutrophil reduction. (j) Comparison of relative frequency of each type of neutrophil occupation in the liver with normal (Control) or depleted (irf8 MO-injected) levels of macrophages after brain-LPS injection, as determined by in vivo time-lapse imaging. (k) Representative 3D images of normal macrophage and neutrophil interactions around the liver at four dpf (corresponding to Video 9). (l) 3D image of macrophage and neutrophil interactions after brain-LPS injection at three hpi in the four dpf larvae showing entry of neutrophils into liver prior to macrophages (corresponding to Video 8). Statistical significance was determined by a two-tailed t-test and with Welch’s correction for unequal variances as determined by a F-test. MO, morpholino. Each data point in scatter plots represents an independent animal; n, number of animals analyzed is shown below each bar graph. Transgenes used: mpeg1:GFP for macrophages, lyz:GFP for neutrophils, and fabp10a:DsRed for hepatocytes.