|
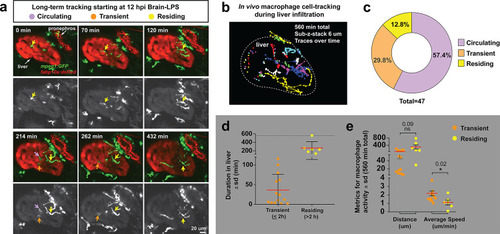
Long-term in vivo tracking of infiltrating macrophages shows that occupation time in the liver can be used for their classification.(a) Representative 3D images from six timepoints corresponding to Video 4 from a four dpf zebrafish which was brain-LPS injected and imaged starting at 12 hpi. Infiltrating macrophages can be classified into three groups (examples shown by arrows of different colors): circulating (present in only a single timepoint), transient (<2 hr) and residing cell (>2 hr). Double transgenic zebrafish labeling macrophages (mpeg1:GFP) and hepatocytes (fabp10a:DsRed) were used to track macrophage infiltration over a 10 hr period. Color overlay of both channels and single GFP channel in grayscale for macrophages are shown. LPS was co-injected with Alexa 568 conjugated dextran to validate brain injections and detect systemic distribution of the injected material based on labeling of the pronephros by the fluorescent dextran. Labeling of pronephros has been previously described after intravenous injection of a fluorescent tracer (Oltrabella et al., 2015), but labeling of proximal kidney tubules can also be observed in transgenic lines expressing a red fluorescent protein. (b) 2D projection of the tracking of infiltrating macrophages in the entire liver over all timepoints of analysis. Each traced cell is represented by a circle for its location at each timepoint if present in the liver, and a line for its movement between the timepoints. Different colors represent different cells. (c) Relative percentage of the different types of infiltrating macrophages based on liver occupation. n = 47 macrophages were tracked and analyzed. (d) Scatter plot shows the total duration of each traced infiltrating macrophage in the ‘transient’ and ‘residing’ groups. (e) Total distance and average speed of each macrophage in the ‘transient’ and ‘residing’ groups. Total distance was not significantly different, but the ‘transient’ macrophages moved faster with a significantly higher average speed than the ‘residing’ cells. sd, standard deviation; ns, not significant.
|