
- Title
-
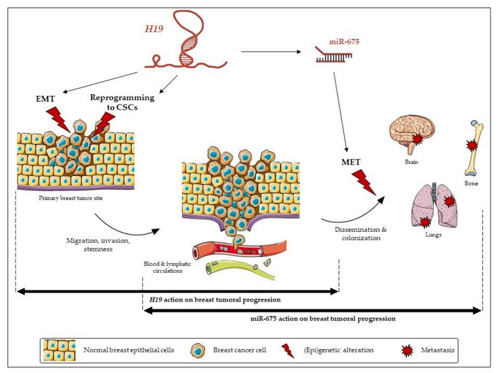
Enhancement of Breast Cancer Cell Aggressiveness by lncRNA H19 and its Mir-675 Derivative: Insight into Shared and Different Actions
- Authors
- Peperstraete, E., Lecerf, C., Collette, J., Vennin, C., Raby, L., Völkel, P., Angrand, P.O., Winter, M., Bertucci, F., Finetti, P., Lagadec, C., Meignan, S., Bourette, R.P., Bourhis, X.L., Adriaenssens, E.
- Source
- Full text @ Cancers
|
|
|
|
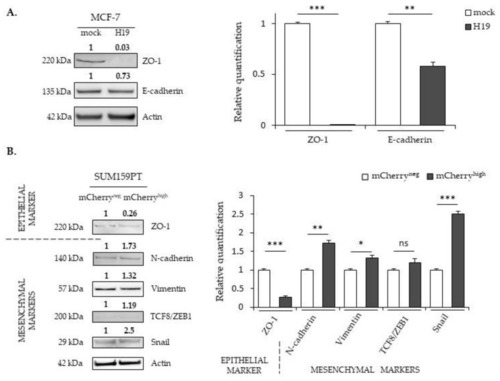
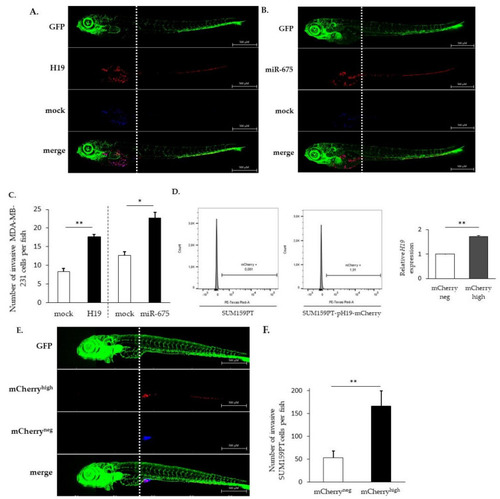
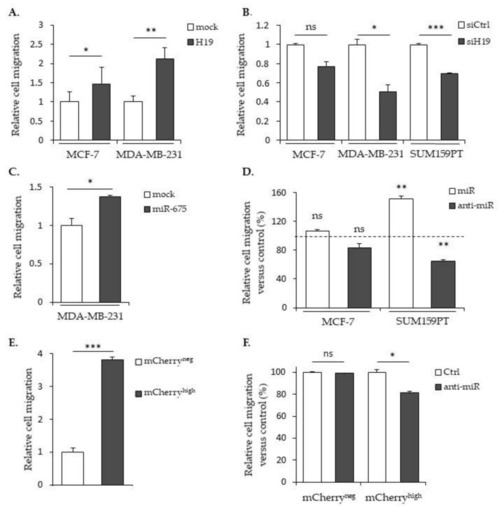
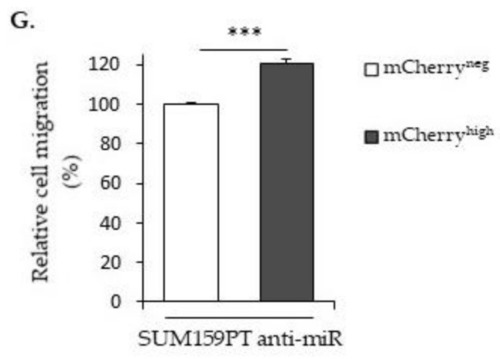
The effects of |
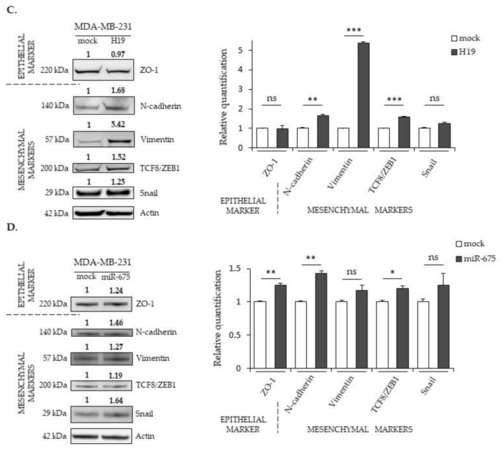
The effects of |

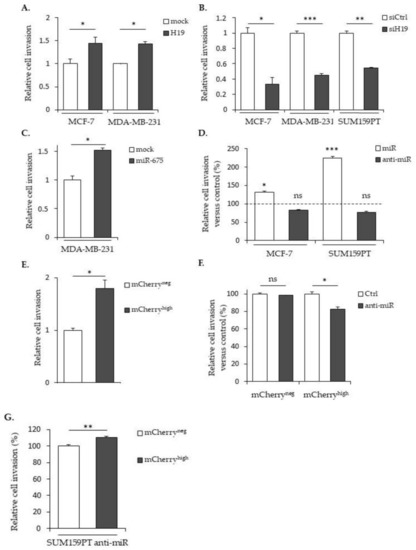
Effects of |
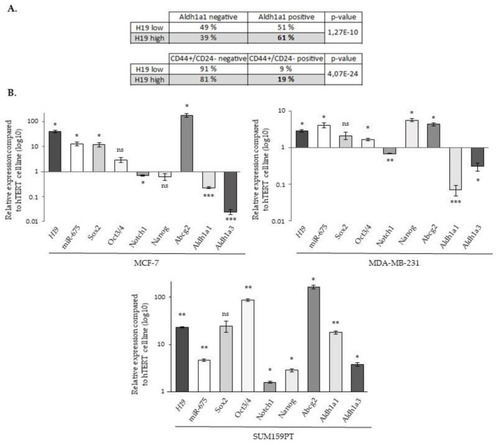
The expression of |
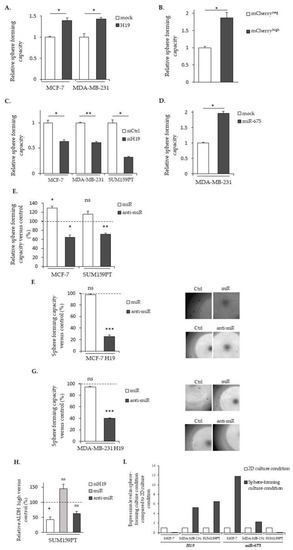
|
The relative contribution of long non-coding (lnc)RNA |