FIGURE

Figure 4

ID
ZDB-FIG-200814-26
Publication
Peperstraete et al., 2020 - Enhancement of Breast Cancer Cell Aggressiveness by lncRNA H19 and its Mir-675 Derivative: Insight into Shared and Different Actions
Other Figures
All Figure Page
Back to All Figure Page
Figure 4

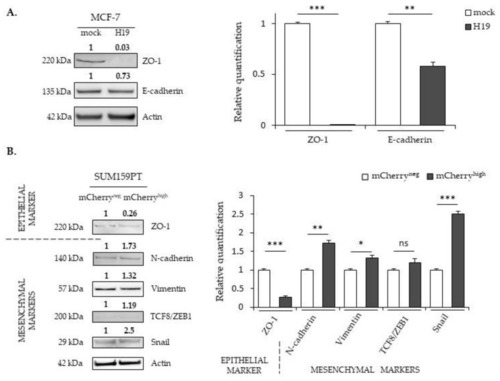
The effects of H19 and miR-675 on the expressions of the epithelial-to-mesenchymal transition (EMT) markers. (A) EMT protein expressions in the MCF-7 control (mock) or H19-stably overexpressing cells (H19), determined by Western blot analysis. (B) EMT protein expressions in SUM159PT-pH19-mCherryneg (mCherryneg) or SUM159PT-pH19-mCherryhigh (mCherryhigh), determined by Western blot analysis. (C) EMT protein expressions in the MDA-MB-231 control (mock) or H19-stably overexpressing cells (H19), determined by Western blot analysis. (D) EMT protein expressions in the MDA-MB-231 control (mock) or miR-675-stably overexpressing cells (miR-675), determined by Western blot analysis. For each panel, actin was used as the equi-loading control. The relative signal intensities were quantified by ImageJ and shown above the protein bands for the representative experiment figure. The quantification of the triplicate is figured in the graph beside. * p < 0.05; ** p < 0.01; *** p < 0.001; ns: not significant. Uncropped blots are shown in Figures S1–S22.

Expression Data

Expression Detail
Antibody Labeling
Phenotype Data

Phenotype Detail
Acknowledgments
This image is the copyrighted work of the attributed author or publisher, and ZFIN has permission only to display this image to its users. Additional permissions should be obtained from the applicable author or publisher of the image. Full text @ Cancers