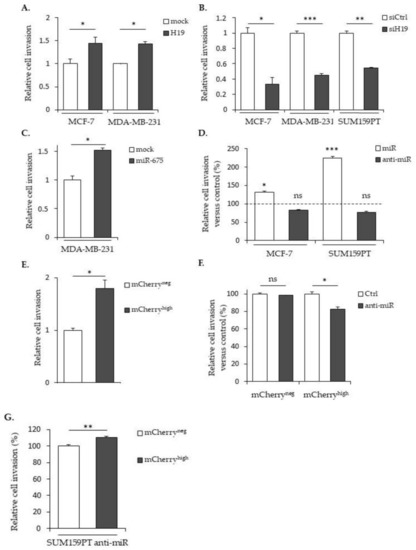
H19 and miR-675 participate in the breast cancer cells invasion. (A) Control (mock) or H19-stably overexpressing cells (H19) were cultured in Transwell for 24 h. Invasive cells were then incubated with 1-mM Hoescht 33258 and counted. (B) Invasive capacities of the control (siCtrl) and H19-knockdowned cells (siH19) determined by Transwell assay. (C) MDA-MB-231 control (mock) or miR-675-stably overexpressing cells (miR-675) were cultured in Transwell for 24 h. Invasive cells were then incubated with 1-mM Hoescht 33258 and counted. (D) Invasive capacities of miR-675-transfected cells (miR) or miR-675-specific inhibitor transfected cells (anti-miR) determined by Transwell assay. Results are presented as the percentage of the control. (E) Relative invasive capacities of SUM159PT-pH19-mCherryneg versus SUM159PT-pH19-mCherryhigh determined by Transwell assay. (F) Invasive capacities of miR-675-specific inhibitor transfected cells (anti-miR). Results are presented as the percentage of the control. (G) Invasive capacities of miR-675-specific inhibitor transfected cells (anti-miR). Results are presented as a percentage of the mCherryneg condition. * p < 0.05; ** p < 0.01; *** p < 0.001; ns: not significant.
|
