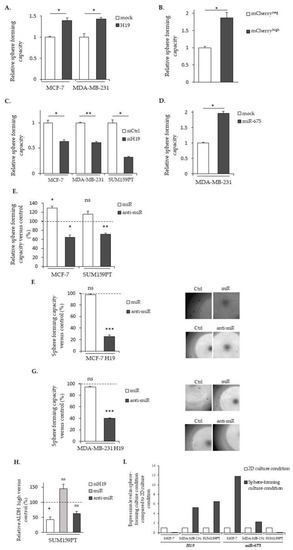
H19 and miR-675 enhance the sphere formation of breast cancer cells. (A) Sphere-forming capacities of the control (mock) or H19-stably overexpressing cells (H19). (B) The relative sphere-forming capacities of SUM159PT-pH19-mCherryneg versus SUM159PT-pH19-mCherryhigh. (C) The sphere-forming capacities of the control (siCtrl) and H19-knockdown cells (siH19). (D) The sphere-forming capacities of the MDA-MB-231 control (mock) or miR-675-stably overexpressing cells (miR-675). (E) The sphere-forming capacities of miR-675-transfected cells (miR) or miR-675-specific inhibitor transfected cells (anti-miR). Results are presented as a percentage of the control. (F) The sphere-forming capacities of MCF-7 H19-stably overexpressing cells transfected with miR-675 (miR) or the miR-675-specific inhibitor (anti-miR). Results are presented as a percentage of the control. Representative pictures for each condition are shown. (G) The sphere-forming capacities of MDA-MB-231 H19-stably overexpressing cells transfected with miR-675 (miR) or the miR-675-specific inhibitor (anti-miR). Results are presented as a percentage of the control. Representative pictures of each condition are shown. (H) ALDEFLUOR-positive subpopulations defined by the ALDEFLUOR assay in H19-knockdown cells (siH19), miR-675-transfected cells (miR) or miR-675-knockdown cells (anti-miR). Results are presented as a percentage of the ALDEFLUOR-positive subpopulation in the native cells. (I) The expression levels of H19 and miR-675 in the cell lines cultured in sphere-forming conditions versus the same cell lines cultured in 2D conditions. * p < 0.05; ** p < 0.01; *** p < 0.001; ns: not significant.
|
