FIGURE SUMMARY
Title

Thyroid hormone receptor beta mutations alter photoreceptor development and function in Danio rerio (zebrafish)

Authors
Deveau, C., Jiao, X., Suzuki, S.C., Krishnakumar, A., Yoshimatsu, T., Hejtmancik, J.F., Nelson, R.F.
Source
Full text @ PLoS Genet.

Two CRISPR mutant lines.

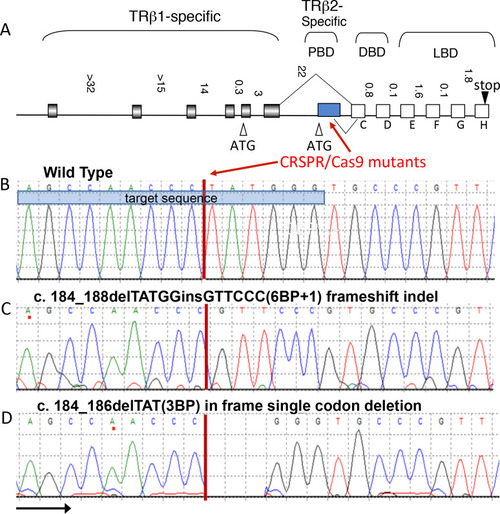
(A) Both mutations are in the first exon of the trβ2 isoform within the N-terminus in the protein binding domain (PBD). Modified from Jones et al. (2003) [14] with permission of Thyroid, Mary Ann Liebert, Inc., publishers, New Rochelle, NY. (B-D) Both mutations targeted the TAT codon resulting in a frameshift indel (6BP+1) and an in-frame codon deletion (3BP). DNA binding domain (DBD), ligand binding domain (LBD).

Live confocal imaging of larval eyes at 4- and 5-days post fertilization (dpf).

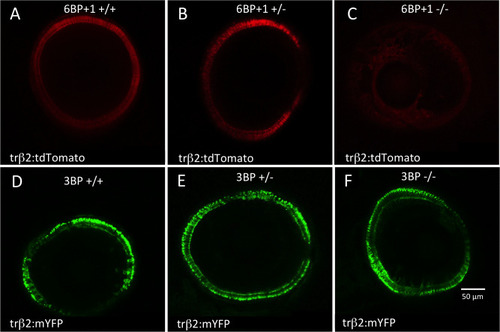
(A) A confocal cross section of a wild type (6BP+/+) (N = 4) larval eye shows a ring of cone layer tdTomato fluorescence under control of a trβ2 promoter in the red cones at the outer edge of the retina. (B) A 6BP+1+/- heterozygote maintains (N = 7) trβ2 fluorescence, but the 6BP+1-/- mutant (N = 14) (C) has no trβ2 fluorescence. The 3BP wild type (N = 12) (D), heterozygote (N = 23) (E), and mutant (N = 5) (F) all exhibit trβ2 fluorescence shown through mYFP expressed by a trβ2 promoter. Eyes are imaged from the larval anterior side showing a cross-section ring of cones. Fluorescence in a ring or semi-ring formation indicates the presence of trβ2 activity. Missing sections of the rings are due to image planes cutting through the cornea.

Antibody stains of 7 dpf larval retinas.

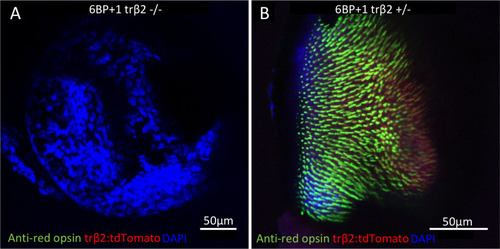
(A) Mutant retina did not have anti-red-opsin or trβ2 reporter fluorescence (N = 4). (B) Heterozygote retina showed the red opsin staining colocalized with tdTomato (N = 4). Images are taken from flattened retinas with the cone outer segments facing upward and in primary focus.

EXPRESSION / LABELING:
Genes:
Antibody:
Fish:
Anatomical Term:
Stage: Days 7-13
PHENOTYPE:
Fish:
Observed In:
Stage: Days 7-13

Anti-red opsin and zpr-1 antibody staining of <italic>6BP+1</italic> adult.

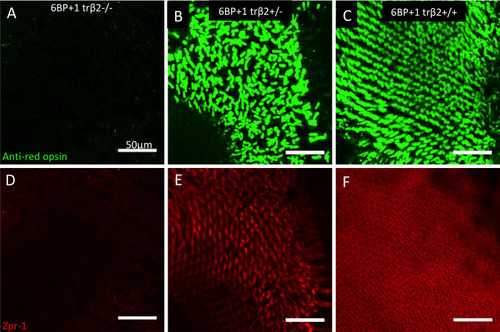
(A, D) Mutant adult retinas (N = 4) did not have red opsin or arr3a (red-green double-cone) antibody fluorescence. (B, E) Heterozygote adult retinas (N = 4) showed bright antibody staining for red opsin and arrestin3a as seen in the wild type (N = 4) (C, F). Scale is the same for each image. Opsin and arr3a images are from the same microscope field, but different planes of focus. Staining was repeated twice for each genotype.

EXPRESSION / LABELING:
Gene:
Antibodies:
Fish:
Anatomical Term:
Stage: Adult
PHENOTYPE:
Fish:
Observed In:
Stage: Adult

Mosaic analysis of cone photoreceptor spatial arrangement with CRISPR/cas9-mediated genome editing of <italic>trβ2</italic>.

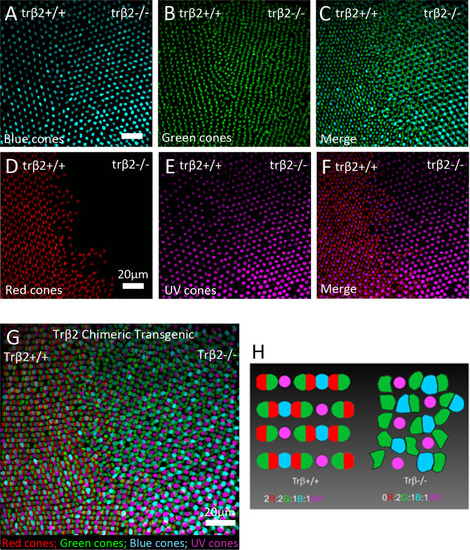
Left side of each image is either wild type or trβ2+/-. Right side of each image is trβ2-/-. Images show patterning of cone types separately (A, B, D, E) and merged in pairs (C, F). (G) All of the cone types are merged in this image. (H) Cone mosaic patterns in wild type/trβ2+/+ (left) or trβ2-/- (right). Red cones (red), green cones (green), blue cones (blue), UV cones (magenta). Scale is the same for each image. The retina is from a 21-day fish, with the embryo injected with CRISPR/Cas9 on day 0. Images are from the same retinal location on one retina. N = 1.

<italic>6BP+1</italic> larval cone PIII ERG spectral response traces.

(A) The 6BP+1 mutant does not respond to 650 nm and 570 nm while maintaining a response to shorter wavelengths (N = 12, 70-point datasets). (B) The heterozygote shows sustained responses across all wavelengths (650–330 nm) (N = 16, 70-point datasets). Only half of the spectral dataset is shown in A and B. Wavelength brightness is given in log units of stimulus attenuation, with 5.0 log units being the dimmest stimulus corresponding to the lowest amplitude response, and 2.0 log units being the brightest stimulus corresponding to the largest amplitude response. Larvae are 5 dpf. Cone PIII responses are isolated with 20 mM Na Aspartate.

<italic>3BP</italic> larval cone PIII ERG spectral response traces.

(A) The 3BP mutant larva (N = 17, 70-point spectral dataset) responds to all wavelengths from 650–330 nm, with no significant differences from the wild type control (N = 17, 70-point spectral datasets) (B). Larvae are 5 dpf.

Maximal dataset amplitudes in <italic>trβ2</italic> genetic strains.

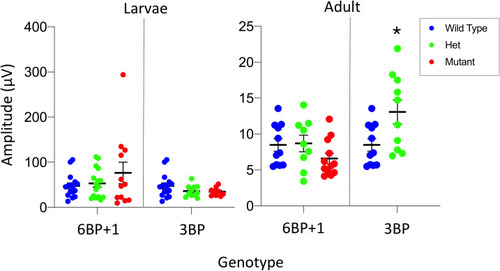
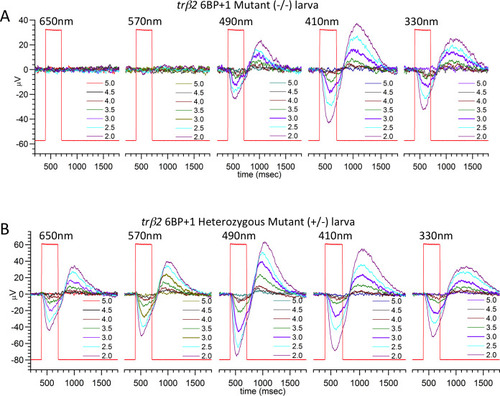
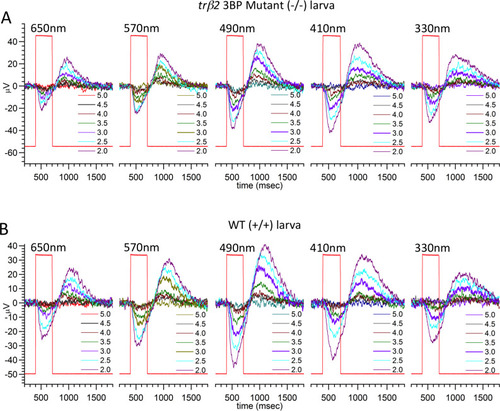
The maximum cone PIII amplitudes for datasets from each genotype are compared. There is no significant difference between the 6BP+1 5–7 dpf mutants (N = 12), het mutants (N = 16), and WT (N = 17); nor is there a significant difference between the 3BP mutants (N = 17), het mutants (N = 33), and WT (N = 17). The 6BP+1 adult mutants (N = 12), het mutants (N = 9) and WT (N = 11) were not significantly different. There was a significant difference (One-way ANOVA, P = 0.02) between the 3BP adult het mutants (N = 10) and wild types (N = 11). There are no 3BP adult mutants. The wild type groups combine fish from 6BP+1 and 3BP heterozygote in-cross spawns.

Irradiance plots: Change in amplitude of arval cone PIII ERG responses as a function of brightness and wavelength.

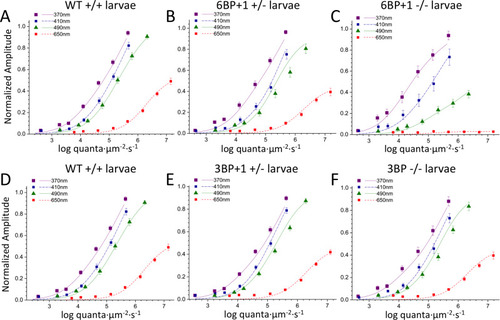
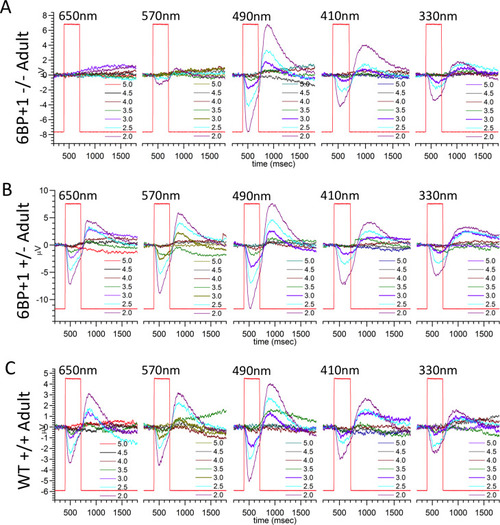
(A, B) The wild type (N = 17 datasets, 1190 points total) and 6BP+1 heterozygote (N = 16 datasets, 1120 points total) irradiance-amplitude curves are similar at 4 modeled wavelengths, while the 6BP+1 mutant (N = 12 datasets, 840 points total) (C) shows a loss of response to 650 nm that does not change even at higher irradiance levels. (D-F) Wild type (same as in A), 3BP heterozygote (N = 33 datasets, 2310 points total), and 3BP mutant (N = 17 datasets, 1190 points total) larvae are similar in their respective irradiance plots.

Spectral plots and cone contribution comparisons for <italic>6BP+1</italic> and <italic>3BP</italic> larva.

(A) Scanning from 330 nm to 650 nm with constant quantal irradiance (4.6 log(quanta∙μm−2∙s−1) the 6BP+1 mutant (N = 12) shows a large drop in response amplitude for long wavelengths and a strong preference for UV wavelengths compared to the wild type (N = 17) and heterozygote (N = 16). (B) The 3BP spectral plot shows a similar spectral pattern in response amplitude across the wavelengths between all genotypes. (C) The 6BP+1 mutant displays a significant drop in red cone contribution (Vr) accompanied by an increase in UV cone contribution (Vu). (D) The cone contribution comparisons between the 3BP genotypes show a trend towards decreasing Vr for the mutant and heterozygote as compared to wild type, though not significant. Spectral curves and fractional cone amplitudes in A-D are generated from the same datasets and model as in Fig 9.

Optomotor response test using a black/white stimulus.

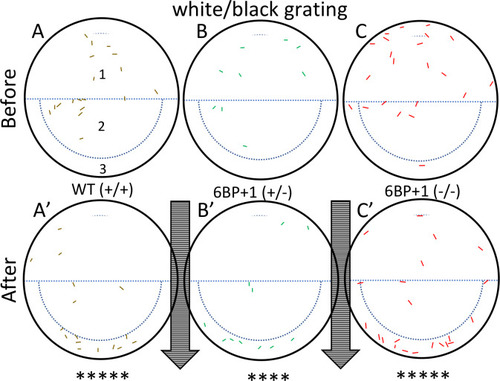
Controls use a drifting black and white grating pattern with wild types (+/+) (N = 18 larvae), 6BP+1 heterozygotes (+/-) (N = 12 larvae), and 6BP+1 mutants (-/-) (N = 23 larvae) at 7 dpf. Colored markings in the dishes represent larval zebrafish locations before and after the one-minute stimulus. The arrows indicate the direction of the stimulus. (A, B, C) Wild types, heterozygotes, and mutants respectively start scattered in the dish. (A’, B’, C’) Each genotype moved with the stimulus showing significant pooling of larvae at the bottom edge. Experiment was repeated 2 times per genotype, with similar outcomes for each trial. Significance, given by the Fisher Exact Test, refers to the combined numbers from the two plates (Table 2).

Optomotor response test using a red and black stimulus.

The wild type (N = 18 larvae) (A, A’) and heterozygote (N = 12 larvae) (B, B’) larva moved with the stimulus as seen in the white/black drifting gratings (Fig 11). (C, C’) The mutant larvae (N = 23 larvae) did not move with the red/black stimulus and remained scattered. The experiment was repeated 2 times, with similar outcomes in each trial. Significance is calculated with the Fisher Exact Test using data from both trials (Table 3).

Optokinetic response tests.

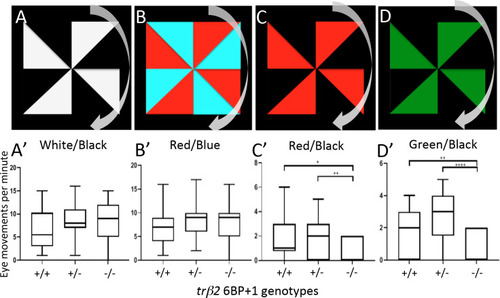
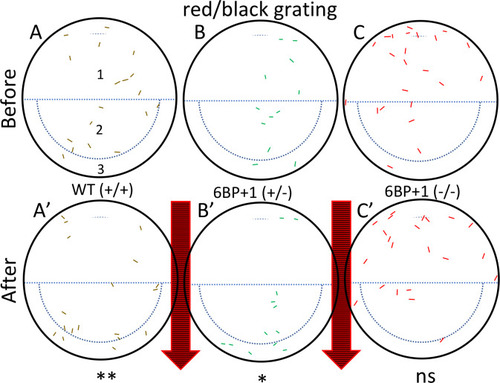
(A, B, C, D) Each larva at 9 dpf was exposed to these four stimuli in left to right order. The pinwheel patterns moved clockwise. (A’, B’) The wild type, 6BP+1 heterozygote, and 6BP+1 mutant responded similarly to the white/black and red/blue stimuli. (C’, D’) The mutant had significantly less eye movements in response to the red/black and green/black stimuli. There was one repetition for each wild type (N = 30), heterozygote (N = 37), and mutant (N = 19) larvae. Monitor peak wavelengths are red (~610 nm), green (~550 nm), and blue (~450 nm). Significance is calculated with Mann-Whitney U test.

PHENOTYPE:
Fish:
Observed In:
Stage: Days 7-13

Adult PIII ERG response plots.

(A) 6BP+1 mutant adults (7 eyecups, 12 datasets) did not respond to 650 nm, but did respond to the maximum brightness level of 570 nm. (B) Heterozygotes respond to every wavelength (6 eyecups, 9 datasets). (C) Wild types respond to all wavelengths (7 eyecups, 11 datasets). Only half of a dataset is shown for A, B, and C.

Spectral analysis of <italic>6BP+1</italic> adults.

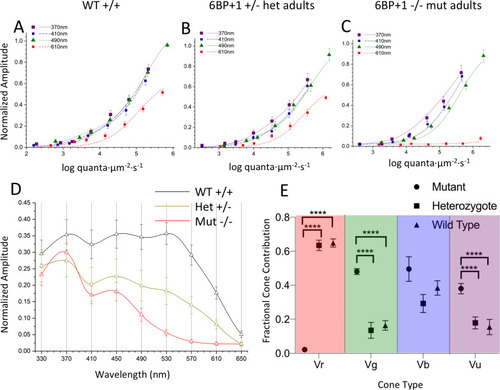
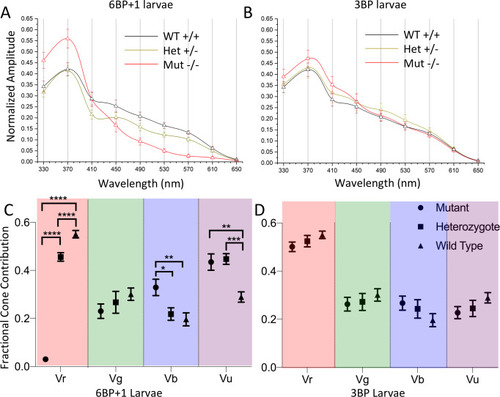
(A, B, C) The irradiance plots for each genotype showed the loss of response to 610 nm in the mutant regardless of brightness. (D) The spectral plot showed a significant loss of amplitude in the heterozygote (N = 9) and mutant (N = 12) at long wavelengths compared to the WT (N = 11). (E) The mutant shows loss of Vr, increase in Vg, and increase in Vu.

RT-qPCR Analysis.

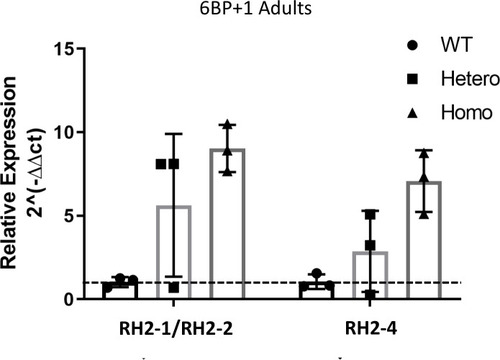
The expression levels of combined RH2-1/RH2-2 and RH2-4 were compared between 6BP+1 wild types (N = 4), heterozygotes (N = 4), and homozygotes (N = 4). The y-axis displays the fold change as compared to wild types, where the mean is set to 1 (dashed line). The x-axis displays the genotypes and opsin types. The expression levels are normalized to the wild type. The experiment was performed twice, each with 3 replicates.

Unillustrated author statements

PHENOTYPE:
Fish:
Observed In:
Stage Range: Day 4 to Day 5
Acknowledgments
This image is the copyrighted work of the attributed author or publisher, and ZFIN has permission only to display this image to its users. Additional permissions should be obtained from the applicable author or publisher of the image. Full text @ PLoS Genet.