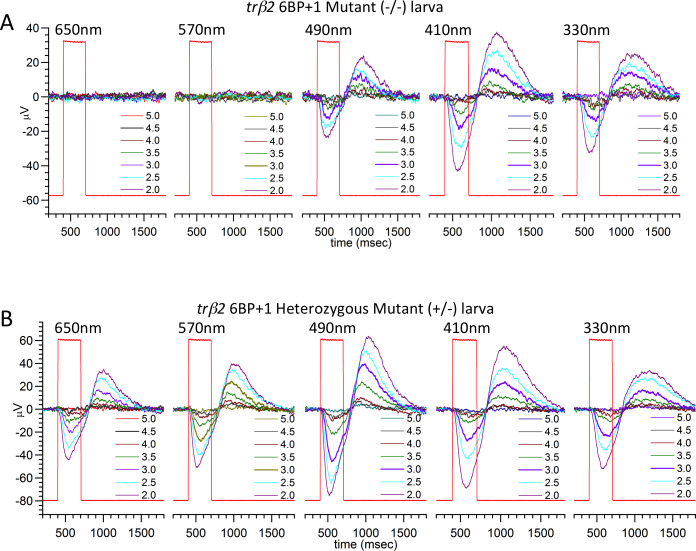
IMAGE

Fig 6

ID
ZDB-IMAGE-200718-34
Source
Figures for Deveau et al., 2020
Image
Figure Caption

Fig 6 <italic>6BP+1</italic> larval cone PIII ERG spectral response traces.

(A) The 6BP+1 mutant does not respond to 650 nm and 570 nm while maintaining a response to shorter wavelengths (N = 12, 70-point datasets). (B) The heterozygote shows sustained responses across all wavelengths (650–330 nm) (N = 16, 70-point datasets). Only half of the spectral dataset is shown in A and B. Wavelength brightness is given in log units of stimulus attenuation, with 5.0 log units being the dimmest stimulus corresponding to the lowest amplitude response, and 2.0 log units being the brightest stimulus corresponding to the largest amplitude response. Larvae are 5 dpf. Cone PIII responses are isolated with 20 mM Na Aspartate.

Figure Data
Acknowledgments
This image is the copyrighted work of the attributed author or publisher, and ZFIN has permission only to display this image to its users. Additional permissions should be obtained from the applicable author or publisher of the image. Full text @ PLoS Genet.