
Image
|
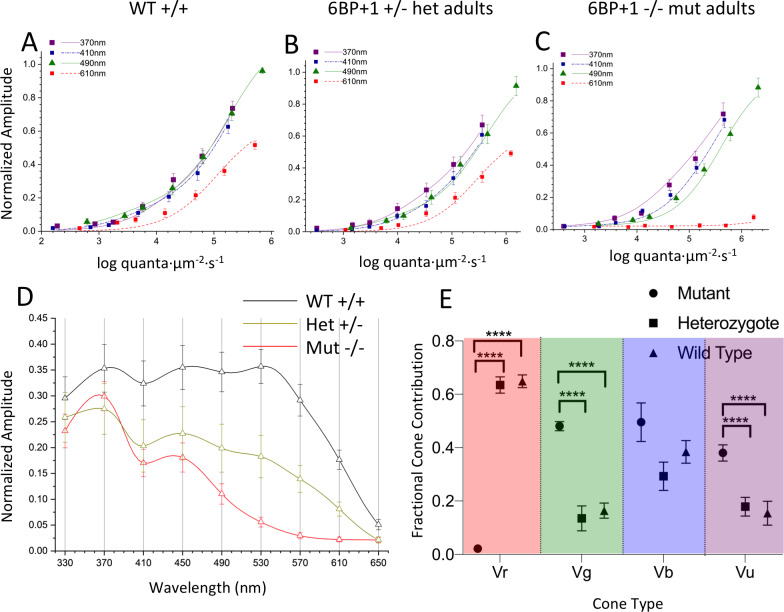
Figure Caption
Fig 15
(A, B, C) The irradiance plots for each genotype showed the loss of response to 610 nm in the mutant regardless of brightness. (D) The spectral plot showed a significant loss of amplitude in the heterozygote (N = 9) and mutant (N = 12) at long wavelengths compared to the WT (N = 11). (E) The mutant shows loss of Vr, increase in Vg, and increase in Vu.
Figure Data
Acknowledgments
This image is the copyrighted work of the attributed author or publisher, and
ZFIN has permission only to display this image to its users.
Additional permissions should be obtained from the applicable author or publisher of the image.
Full text @ PLoS Genet.