
Image
|
Figure Caption
Fig 12
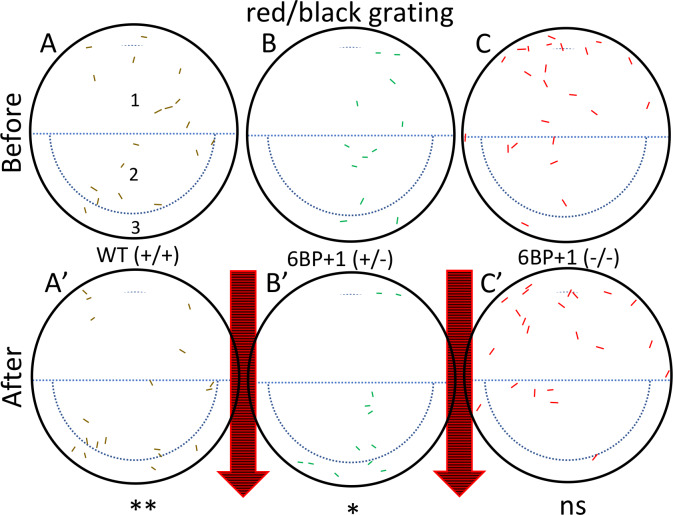
The wild type (N = 18 larvae) (A, A’) and heterozygote (N = 12 larvae) (B, B’) larva moved with the stimulus as seen in the white/black drifting gratings (
Figure Data
Acknowledgments
This image is the copyrighted work of the attributed author or publisher, and
ZFIN has permission only to display this image to its users.
Additional permissions should be obtained from the applicable author or publisher of the image.
Full text @ PLoS Genet.