IMAGE

Fig 11

ID
ZDB-IMAGE-200718-38
Source
Figures for Deveau et al., 2020
Image
Figure Caption

Fig 11 Optomotor response test using a black/white stimulus.

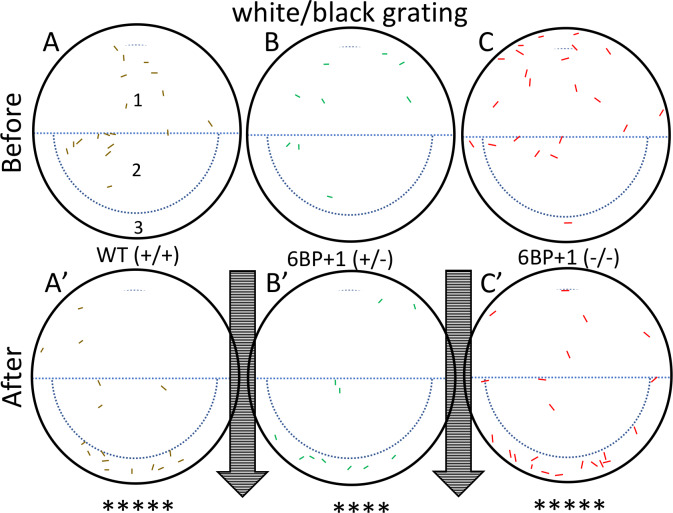
Controls use a drifting black and white grating pattern with wild types (+/+) (N = 18 larvae), 6BP+1 heterozygotes (+/-) (N = 12 larvae), and 6BP+1 mutants (-/-) (N = 23 larvae) at 7 dpf. Colored markings in the dishes represent larval zebrafish locations before and after the one-minute stimulus. The arrows indicate the direction of the stimulus. (A, B, C) Wild types, heterozygotes, and mutants respectively start scattered in the dish. (A’, B’, C’) Each genotype moved with the stimulus showing significant pooling of larvae at the bottom edge. Experiment was repeated 2 times per genotype, with similar outcomes for each trial. Significance, given by the Fisher Exact Test, refers to the combined numbers from the two plates (Table 2).

Acknowledgments
This image is the copyrighted work of the attributed author or publisher, and ZFIN has permission only to display this image to its users. Additional permissions should be obtained from the applicable author or publisher of the image. Full text @ PLoS Genet.