
- Title
-
Hif-1alpha stabilisation is protective against infection in zebrafish comorbid models
- Authors
- Schild, Y., Mohamed, A., Wootton, E.J., Lewis, A., Elks, P.M.
- Source
- Full text @ FEBS J.
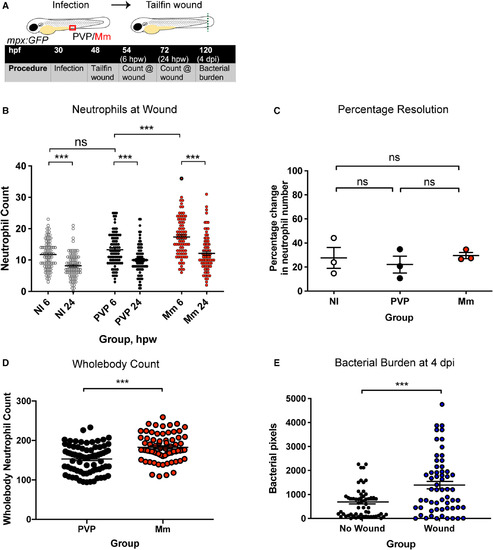
Mm infection induced neutrophil emergency haematopoiesis and was increased by a comorbid wound. (A) Schematic of experiment for B, C and E. (B) Neutrophil numbers at the wound at 6 and 24 hpw of mpx:GFP embryos. Groups are NI, control injection with PVP and Mm injection. Data shown are mean ± SEM, n = 75–85 accumulated from three independent experiments. Statistics were determined using one‐way ANOVA (with Bonferroni’s multiple comparisons test). P values shown are as follows: ns = not significant and ***P < 0.001. (C) Percentage resolution of neutrophilic inflammation (percentage change in neutrophil number at the tailfin wound between 6 and 24 hpw). Groups are NI, control injection with PVP and Mm injection. Data shown are mean ± SEM, n = 75–85 from three independent experiments. Statistics were determined using one‐way ANOVA (with Bonferroni’s multiple comparisons test). P values shown are as follows: ns = not significant. (D) Total, whole‐body neutrophil numbers at 2 dpf, after 18 hpi with PVP or Mm. Data shown are mean ± SEM, n = 69–74 accumulated from three independent experiments. Statistics were determined using an unpaired t‐test. P values shown are as follows: ***P < 0.001. (E) Bacterial burden of larvae with or without a tailfin wound. Data shown are mean ± SEM, n = 58 accumulated from three independent experiments. Statistics were determined using an unpaired t‐test. P values shown are as follows: ***P < 0.001. |
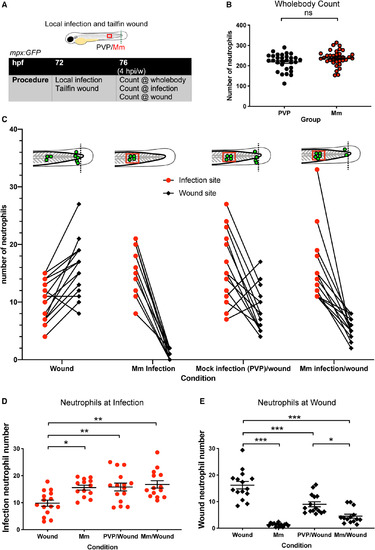
Local somite Mm infection lowers neutrophil numbers at the tailfin wound. (A) Schematic of experiment for B–E. (B) Total, whole‐body neutrophil numbers in mpx:GFP embryos at 4 hpw after local somite injection with PVP or Mm. Data shown are mean ± SEM, n = 30–35 accumulated from three independent experiments. P values shown are as follows: ns = not significant. (C) Number of neutrophils at site of infection and tailfin wound at 4 hpi/w in mpx:GFP embryos. The groups are Wound (tailfin wound alone), Mm infection (Mm infection alone), Mock infection (PVP)/wound (injection of PVP into the somite alongside a tailfin wound) and Mm infection/wound (injection of Mm into the somite alongside a tailfin wound). Individual embryos are represented as lines joining their respective infection and tailfin wound neutrophil numbers. Data shown are mean ± SEM, n = 9–13 representative of three independent experiments. (D) Neutrophil numbers at the site of infection at 4 hpi. Data shown are mean ± SEM, n = 9–13 representative of three independent experiments. Statistics were determined using an unpaired t‐test. P values shown are as follows: *P < 0.05, and **P < 0.01. (E) Neutrophil numbers at the site of tailfin wound at 4 hpi. Data shown are mean ± SEM, n = 9–13 representative of three independent experiments. Statistics were determined using an unpaired t‐test. P values shown are as follows: *P < 0.05, and ***P < 0.001. |
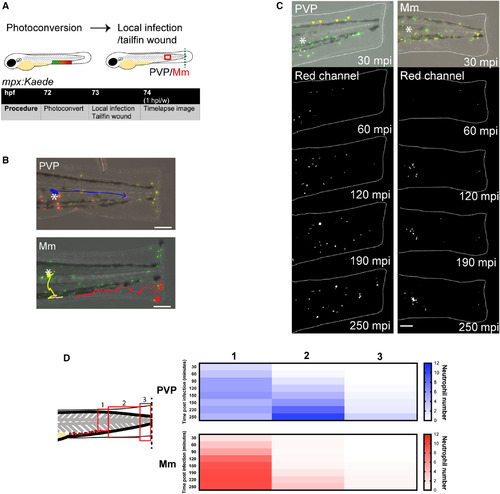
Mm retains neutrophils at the somite infection site at the expense of migration to the tailfin wound. (A) Schematic of experiment for B–D, showing PC of neutrophils in the CHT of mpx:Kaede embryos. (B) Example fate‐tracks of red neutrophils that were photoconverted in the CHT and migrated to either PVP or Mm infection in the somite over 4 hpi/w. Data shown are examples from two independent experiments with 10 fish per group. Scale bar = 100 μm. (C) Stereo‐fluorescence micrographs of the location of red photoconverted neutrophils that originated in the CHT in PVP and Mm‐infected larvae. Data shown are examples from two independent experiments with 10 fish per group. Scale bar = 100 μm. (D) Heatmap of location of red photoconverted neutrophils that originated in the CHT over time. Data shown are n = 5 embryos per group accumulated from two independent experiments. |
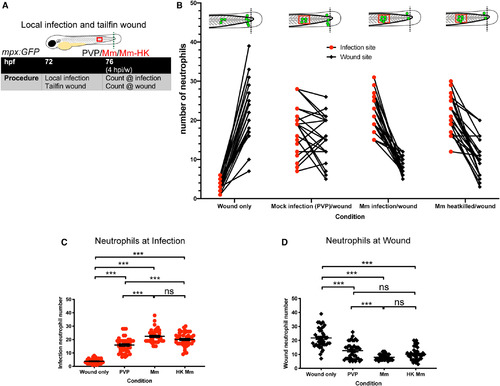
HK Mm are sufficient for increased neutrophil recruitment to the infection site. (A) Schematic of experiment for B–D. (B) Number of neutrophils at site of infection and tailfin wound at 4 hpi/w in mpx:GFP embryos. The groups are Wound (tailfin wound alone), Mock infection (PVP)/wound (injection of PVP into the somite alongside a tailfin wound), Mm infection/wound (injection of Mm into the somite alongside a tailfin wound) and HK Mm infection/wound (injection of HK Mm into the somite alongside a tailfin wound). Individual embryos are represented as lines joining their respective infection and tailfin wound neutrophil numbers. Data shown are mean ± SEM, n = 21 representative of three independent experiments. (C) Neutrophil numbers at the site of infection at 4 hpi. Data shown are mean ± SEM, n = 42 representative of three independent experiments. Statistics were determined using an unpaired t‐test. P values shown are as follows: ns = not significant and ***P < 0.001. (D) Neutrophil numbers at the site of tailfin wound at 4 hpi. Data shown are mean ± SEM, n = 42 representative of three independent experiments. Statistics were determined using an unpaired t‐test. P values shown are as follows: ns = not significant and ***P < 0.001. |

Neutrophils preferentially migrated to a new infection stimulus rather than patrol the wound site. (A) Schematic of experiment for B–F. (B) Stereo‐fluorescence micrographs of a tailfin transected mpx:Kaede embryo after either 30th somite, 26/27th somite, or 23–24 somite infection with Mm at 0 and 2hpi. The local infection site is shown by a yellow ring, and PC of wound neutrophils is shown by the box. With 30 somite injection red (wound‐experienced) neutrophils have started migration to the infection site by the time the time lapse has been started and are almost all at the infection site by 2 hpi (white ring). The 26‐27th somite infection does not start recruiting wound‐experienced neutrophil by the time of the time lapse, but has done so after 2 hpi (white arrowheads). Infection into the 23rd–24th somite does not recruit any wound‐experienced neutrophils over a 2‐h time course. Representative example from n = 9 embryos per group from three independent experiments. Scale bar = 150 μm. (C) Stereo‐fluorescence micrographs of a tailfin transected mpx:Kaede embryo after 26/27th somite infection with Mm. Wound‐naïve neutrophils are green only, and those photoconverted at the wound at timepoint zero (wound‐experienced) begin as red‐only and regain GFP (therefore giving a yellow overlay) over the course of the time lapse as nascent Kaede fluorescent protein is made. Both wound‐naïve (white arrowhead) and wound‐experienced (yellow arrowhead) are recruited to the localised site of Mm infection before 110 mpc, even though the time lapse is begun at 5 hpw, a timepoint when neutrophils would normally still be recruited to the tailfin transection. Representative example from data shown in D‐F, n = 12 embryos from three independent experiments. Scale bar = 100 μm. (D) Number of green, wound‐naïve neutrophils at infection site over 1.5 hpi. Data shown are mean ± SEM, n = 12 embryos accumulated from three independent experiments. (E) Number of red, wound‐experienced neutrophils at infection site over 1.5 hpi. Data shown are mean ± SEM, n = 12 embryos accumulated from three independent experiments. (F) Number of red, wound‐experienced neutrophils at wound site over 1.5 hpi. Data shown are mean ± SEM, n = 12 embryos accumulated from three independent experiments. |
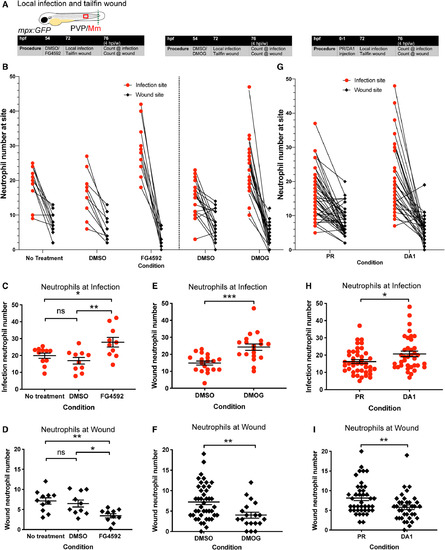
Hif‐1α stabilisation increased neutrophil numbers at infection at the expense of those at the tailfin wound. (A) Schematic of experiment for B–F. (B) Number of neutrophils at site of infection and tailfin wound of mpx:GFP embryos at 4 hpi/w after Hif‐1α stabilisation with FG4592 or DMOG with no treatment and DMSO controls. Data shown are mean ± SEM, n = 9–15 representative of three independent experiments. (C) Neutrophil numbers at the infection site at 4 hpi with DMSO and FG4592 treatment. Data shown are mean ± SEM, n = 10–11 representative of three independent experiments. Statistics were determined using one‐way ANOVA (with Bonferroni’s multiple comparisons test). P values shown are as follows: ns = not significant, *P < 0.05, and **P < 0.01. (D) Neutrophil numbers at the wound site at 4 hpi with DMSO and FG4592 treatment. Data shown are mean ± SEM, n = 10–11 representative of three independent experiments. Statistics were determined using one‐way ANOVA (with Bonferroni’s multiple comparisons test). P values shown are as follows: ns = not significant, *P< 0.05, and **P < 0.01. (E) Neutrophil numbers at the infection site at 4 hpi with DMSO and DMOG treatment. Data shown are mean ± SEM, n = 19 representative of three independent experiments. Statistics were determined using an unpaired t‐test. P values shown are as follows: ***P < 0.001. (F) Neutrophil numbers at the wound site at 4 hpi with DMSO and DMOG treatment. Data shown are mean ± SEM, n = 19 representative of three independent experiments. Statistics were determined using an unpaired t‐test. P values shown are as follows: **P < 0.01. (G) Number of neutrophils at site of infection and tailfin wound at 4 hpi/w after Hif‐1α stabilisation with DA1 or PR controls. Data shown are mean ± SEM, n = 20–22 representative of three independent experiments. (H) Neutrophil numbers at the infection site at 4 hpi with PR and DA1. Data shown are mean ± SEM, n = 19 representative of three independent experiments. Statistics were determined using an unpaired t‐test. P values shown are as follows: *P < 0.05. (I) Neutrophil numbers at the wound site at 4 hpi with PR and DA1 treatment. Data shown are mean ± SEM, n = 36–41 accumulated from three independent experiments. Statistics were determined using an unpaired t‐test. P values shown are as follows: **P < 0.01. |
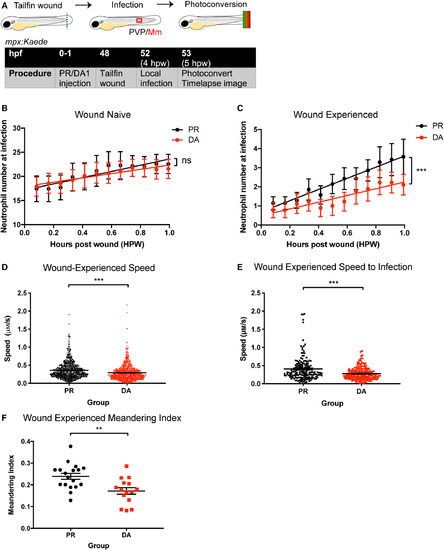
Stabilisation of Hif‐1α delayed the migration of wound‐experienced neutrophils to a local site of Mm infection. (A) Schematic of experiment for B‐F. (B) Number of green, wound‐naïve neutrophils at infection site over 1 hpw in mpx:Kaede embryos. Groups shown are DA Hif‐1α (DA, red points) and PR controls (black points). Data shown are mean ± SEM, n = 7–9 embryos accumulated from three independent experiments. Line of best fit shown is calculated by linear regression. P value shown is for the difference between the two slopes. P values shown are as follows: ns = not significant. (C) Number of red, wound‐experienced neutrophils at infection site over 1 hpw. Groups shown are DA Hif‐1α (DA, red points) and PR controls (black points). Data shown are mean ± SEM, n = 7–9 embryos accumulated from three independent experiments. Line of best fit shown is calculated by linear regression. P value shown is for the difference between the two slopes. P values shown are as follows: ***P < 0.001. (D) Speed of red, wound‐experienced neutrophil movement at the wound site. Groups shown are DA Hif‐1α (DA) and PR controls. Data shown are mean ± SEM, n = 5–6 embryos accumulated from three independent experiments. Statistics were determined using an unpaired t‐test. P values shown are as follows: ***P < 0.001. (E) Speed of red, wound‐experienced neutrophils migrating from the wound site to the infection site. Groups shown are DA Hif‐1α (DA) and PR controls. Data shown are mean ± SEM, n = 5–6 embryos accumulated from three independent experiments. Statistics were determined using an unpaired t‐test. P values shown are as follows: ***P < 0.001. (F) Meandering index of red, wound‐experienced neutrophils migrating from the wound site to the infection site. Groups shown are DA Hif‐1α (DA) and PR controls. Data shown are mean ± SEM, n = 15–18 embryos accumulated from two independent experiments. Statistics were determined using an unpaired t‐test. P values shown are as follows: **P < 0.01. Scale bars = 500 μm. |
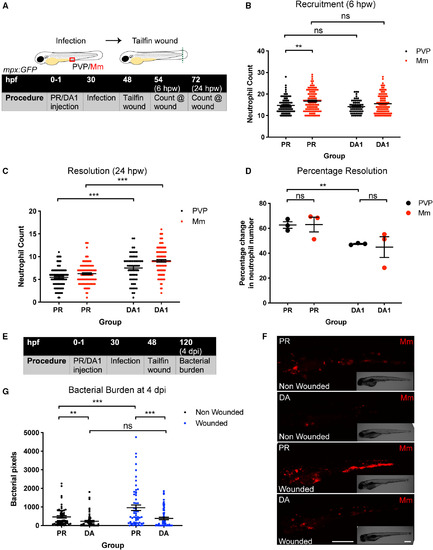
Mm burden was decreased by Hif‐1α stabilisation, despite delayed resolution of neutrophilic inflammation. (A) Schematic of experiment for B‐D. (B) Neutrophil numbers recruited to the tailfin wound at 6 hpw in mpx:GFP embryos. Groups are PR and DA Hif‐1α (DA) injected at 30 hpf with PVP or Mm. Data shown are mean ± SEM, n = 62–111 accumulated from three independent experiments. Statistics were determined using one‐way ANOVA (with Bonferroni’s multiple comparisons test). P values shown are as follows: ns = not significant and **P < 0.01. (C) Neutrophil numbers at the tailfin wound at 24 hpw. Groups are PR and DA Hif‐1α (DA) injected at 30 hpf with PVP or Mm. Data shown are mean ± SEM, n = 62–111 accumulated from three independent experiments. Statistics were determined using one‐way ANOVA (with Bonferroni’s multiple comparisons test). P values shown are as follows: ***P < 0.001. (D) Percentage resolution of neutrophil inflammation (between 6 and 24 hpw). Groups are PR and DA Hif‐1α (DA) injected at 30 hpf with PVP or Mm. Data shown are mean ± SEM, n = 62–111 accumulated from three independent experiments. Statistics were determined using one‐way ANOVA (with Bonferroni’s multiple comparisons test). P values shown are as follows: ns = not significant and **P < 0.01. (E) Schematic of experiment for G‐F. (F) Stereo‐fluorescence micrographs of Mm mCherry‐infected 4 dpi larvae after injection with DA Hif‐1α (DA1) and PR as a negative control and either wounded at 48 hpf or nonwounded in mpx:GFP embryos. Representative images from data shown in G, with n = 58 accumulated from three independent experiments. (G) Bacterial burden of larvae shown in (F). Data shown are mean ± SEM, n = 58 accumulated from three independent experiments. Statistics were determined using one‐way ANOVA (with Bonferroni’s multiple comparisons test). P values shown are as follows: ns = not significant, **P < 0.01, and ***P < 0.001. |