
Fig. 7
- ID
- ZDB-FIG-210204-21
- Publication
- Schild et al., 2020 - Hif-1alpha stabilisation is protective against infection in zebrafish comorbid models
- Other Figures
- All Figure Page
- Back to All Figure Page
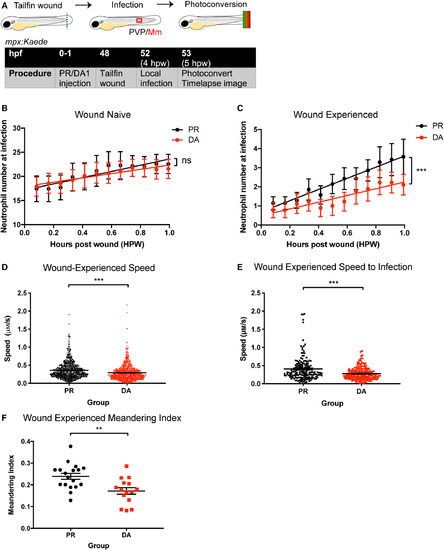
Stabilisation of Hif‐1α delayed the migration of wound‐experienced neutrophils to a local site of Mm infection. (A) Schematic of experiment for B‐F. (B) Number of green, wound‐naïve neutrophils at infection site over 1 hpw in mpx:Kaede embryos. Groups shown are DA Hif‐1α (DA, red points) and PR controls (black points). Data shown are mean ± SEM, n = 7–9 embryos accumulated from three independent experiments. Line of best fit shown is calculated by linear regression. P value shown is for the difference between the two slopes. P values shown are as follows: ns = not significant. (C) Number of red, wound‐experienced neutrophils at infection site over 1 hpw. Groups shown are DA Hif‐1α (DA, red points) and PR controls (black points). Data shown are mean ± SEM, n = 7–9 embryos accumulated from three independent experiments. Line of best fit shown is calculated by linear regression. P value shown is for the difference between the two slopes. P values shown are as follows: ***P < 0.001. (D) Speed of red, wound‐experienced neutrophil movement at the wound site. Groups shown are DA Hif‐1α (DA) and PR controls. Data shown are mean ± SEM, n = 5–6 embryos accumulated from three independent experiments. Statistics were determined using an unpaired t‐test. P values shown are as follows: ***P < 0.001. (E) Speed of red, wound‐experienced neutrophils migrating from the wound site to the infection site. Groups shown are DA Hif‐1α (DA) and PR controls. Data shown are mean ± SEM, n = 5–6 embryos accumulated from three independent experiments. Statistics were determined using an unpaired t‐test. P values shown are as follows: ***P < 0.001. (F) Meandering index of red, wound‐experienced neutrophils migrating from the wound site to the infection site. Groups shown are DA Hif‐1α (DA) and PR controls. Data shown are mean ± SEM, n = 15–18 embryos accumulated from two independent experiments. Statistics were determined using an unpaired t‐test. P values shown are as follows: **P < 0.01. Scale bars = 500 μm. |