
Fig. 6
- ID
- ZDB-FIG-210204-20
- Publication
- Schild et al., 2020 - Hif-1alpha stabilisation is protective against infection in zebrafish comorbid models
- Other Figures
- All Figure Page
- Back to All Figure Page
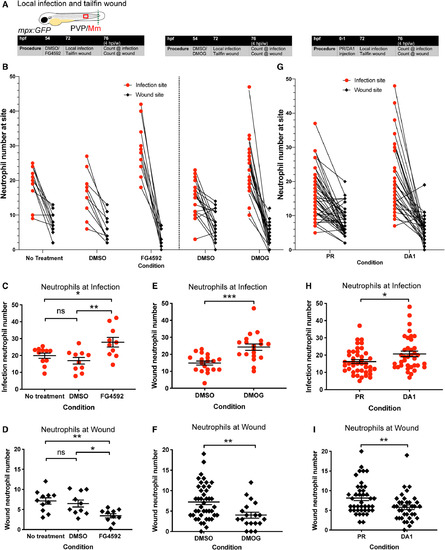
Hif‐1α stabilisation increased neutrophil numbers at infection at the expense of those at the tailfin wound. (A) Schematic of experiment for B–F. (B) Number of neutrophils at site of infection and tailfin wound of mpx:GFP embryos at 4 hpi/w after Hif‐1α stabilisation with FG4592 or DMOG with no treatment and DMSO controls. Data shown are mean ± SEM, n = 9–15 representative of three independent experiments. (C) Neutrophil numbers at the infection site at 4 hpi with DMSO and FG4592 treatment. Data shown are mean ± SEM, n = 10–11 representative of three independent experiments. Statistics were determined using one‐way ANOVA (with Bonferroni’s multiple comparisons test). P values shown are as follows: ns = not significant, *P < 0.05, and **P < 0.01. (D) Neutrophil numbers at the wound site at 4 hpi with DMSO and FG4592 treatment. Data shown are mean ± SEM, n = 10–11 representative of three independent experiments. Statistics were determined using one‐way ANOVA (with Bonferroni’s multiple comparisons test). P values shown are as follows: ns = not significant, *P< 0.05, and **P < 0.01. (E) Neutrophil numbers at the infection site at 4 hpi with DMSO and DMOG treatment. Data shown are mean ± SEM, n = 19 representative of three independent experiments. Statistics were determined using an unpaired t‐test. P values shown are as follows: ***P < 0.001. (F) Neutrophil numbers at the wound site at 4 hpi with DMSO and DMOG treatment. Data shown are mean ± SEM, n = 19 representative of three independent experiments. Statistics were determined using an unpaired t‐test. P values shown are as follows: **P < 0.01. (G) Number of neutrophils at site of infection and tailfin wound at 4 hpi/w after Hif‐1α stabilisation with DA1 or PR controls. Data shown are mean ± SEM, n = 20–22 representative of three independent experiments. (H) Neutrophil numbers at the infection site at 4 hpi with PR and DA1. Data shown are mean ± SEM, n = 19 representative of three independent experiments. Statistics were determined using an unpaired t‐test. P values shown are as follows: *P < 0.05. (I) Neutrophil numbers at the wound site at 4 hpi with PR and DA1 treatment. Data shown are mean ± SEM, n = 36–41 accumulated from three independent experiments. Statistics were determined using an unpaired t‐test. P values shown are as follows: **P < 0.01. |