FIGURE SUMMARY
Title

FGF21 Mimics a Fasting-Induced Metabolic State and Increases Appetite in Zebrafish

Authors
Blanco, A.M., Bertucci, J.I., Unniappan, S.
Source
Full text @ Sci. Rep.

ZFIN is incorporating published figure images and captions as part of an ongoing project. Figures from some publications have not yet been curated, or are not available for display because of copyright restrictions.

ZFIN is incorporating published figure images and captions as part of an ongoing project. Figures from some publications have not yet been curated, or are not available for display because of copyright restrictions.

EXPRESSION / LABELING:
Genes:
Fish:
Condition:
Anatomical Terms:
Stage: Adult
PHENOTYPE:
Fish:
Condition:
Observed In:
Stage: Adult

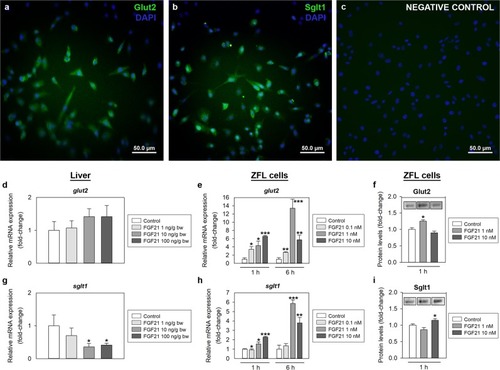
Effects of FGF21 on glucose transporters in zebrafish liver. (a–c) Glut2-like (a; green) and Sglt1-like (b; green) immunoreactivity in ZFL cells detected by immunohistochesmistry. Negative control (c) was incubated in the absence of primary antibody. All images are merged with DAPI showing nuclei in blue. Scale bars (µm) are indicated in each image. (d,g) Expression of mRNAs encoding Glut2 and Sglt1 in the zebrafish liver 1 h after intraperitoneal administration of saline alone (control) or containing 1, 10 or 100 ng/g bw of FGF21. Data obtained by RT-qPCR are expressed as mean + SEM (n = 6). Asterisks denote significant differences between control and treated groups assessed by t-test (*p < 0.05). (e,h) Concentration and time-dependent effects of FGF21 on glucose transporters gene expression in ZFL cells. Cells were incubated with culture media alone (control) or containing different concentrations of FGF21 (0.1, 1 and 10 nM) during 1 and 6 h. Data obtained by RT-qPCR are shown as mean + SEM of the results obtained in two different experiments (n = 6 in each experiment). Asterisks denote significant differences between control and treated groups (*p < 0.05, **p < 0.01, ***p < 0.001). (f,i) Protein levels of Glut2 and Sglt1 in ZFL cells 1 h after exposure to 1 or 10 nM FGF21. Data obtained by Western blot is shown as mean + SEM (n = 4). A representative cropped blot per treatment is shown. Full-length blots/gels are presented in Supplementary Figure 1. Asterisks denote significant differences between control and treated groups (*p < 0.05). FGF21, fibroblast growth factor 21; Glut2, glucose transporter 2; Sglt1, sodium-glucose cotransporter 1.

EXPRESSION / LABELING:
Genes:
Fish:
Anatomical Term:
Stage: Adult

ZFIN is incorporating published figure images and captions as part of an ongoing project. Figures from some publications have not yet been curated, or are not available for display because of copyright restrictions.

EXPRESSION / LABELING:
Genes:
Fish:
Anatomical Term:
Stage: Adult

ZFIN is incorporating published figure images and captions as part of an ongoing project. Figures from some publications have not yet been curated, or are not available for display because of copyright restrictions.

EXPRESSION / LABELING:
Genes:
Fish:
Anatomical Term:
Stage: Adult
Acknowledgments
This image is the copyrighted work of the attributed author or publisher, and ZFIN has permission only to display this image to its users. Additional permissions should be obtained from the applicable author or publisher of the image. Full text @ Sci. Rep.