FIGURE SUMMARY
Title

Efficient and risk-reduced genome editing using double nicks enhanced by bacterial recombination factors in multiple species

Authors
He, X., Chen, W., Liu, Z., Yu, G., Chen, Y., Cai, Y.J., Sun, L., Xu, W., Zhong, L., Gao, C., Chen, J., Zhang, M., Yang, S., Yao, Y., Zhang, Z., Ma, F., Zhang, C.C., Lu, H.P., Yu, B., Cheng, T.L., Qiu, J., Sheng, Q., Zhou, H.M., Lv, Z.R., Yan, J., Zhou, Y., Qiu, Z., Cui, Z., Zhang, X., Meng, A., Sun, Q., Yang, Y.
Source
Full text @ Nucleic Acids Res.

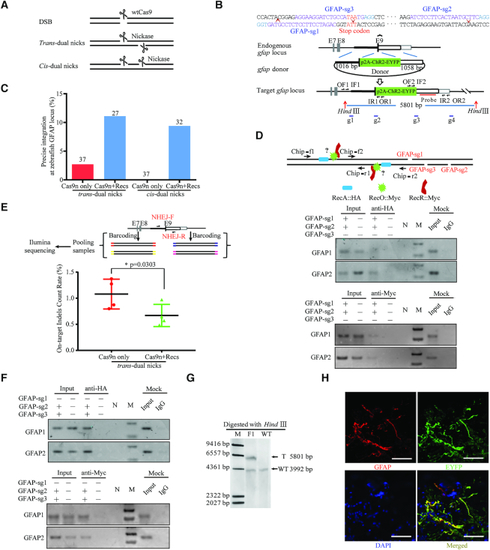
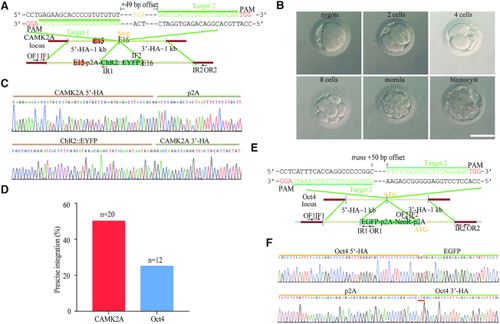
Design and optimisation of dual nicks-based gene KI at the gfap locus in zebrafish. (A) Schematic illustrating DNA break types. (B) Schematic overview of the strategy to generate a GFAP-p2A-ChR2-EYFP KI allele. The nested PCR primers used for knock-in identification are shown (Supplementary Table S4). (C) Germline transmission rate of ChR2-EYFP precise integration at the gfap locus with trans- and cis-dual nicks. (D) ChIP assay at the gfap locus subjected to trans-dual nicks processing. Each sample contained 500 embryos and three replicates were performed. (E) On-target indels analysis using Next-Gen-based multiplexed sequencing. The ratio data was presented as the percentage of reads with indels to the total reads according to the reference (62). Each sample contained 30 embryos and two replicates were performed. Comparisons between groups were analyzed with Student's t-test. * indicates P < 0.05. Error bars denote s.d. (F) ChIP assay at the gfap locus subjected to cis-dual nicks processing. Each sample contained 500 embryos and three replicates were performed. (G) Representative Southern blotting analysis of the GFAP-p2A-ChR2-EYFP targeted allele. T, KI target band. WT, wild type band. (H) ChR2-EYFP signals in the adult brain sections (hindbrain), nuclei in blue were stained with DAPI. Scale bar, 50 μm.

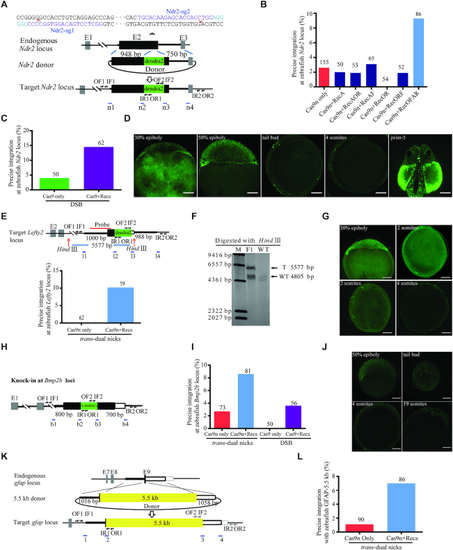
RecOFAR facilitate dual nicks-based efficient gene KI at multiple loci in zebrafish. (A) Schematic overview of the strategy to generate an Ndr2-linker-dendra2-V5 KI allele. The nested PCR primers used for knock-in identification are shown (Supplementary Table S4). (B) Germline transmission rate of linker-dendra2-V5 precise integration at the Ndr2 locus with double-nicking approach. All four Rec factors are required for the enhancing effect. (C) Germline transmission rate of linker-dendra2 precise integration at the Ndr2 locus with DSB approach. (D) Dendra2 fluorescence pattern in the Ndr2-linker-dendra2-V5 KI-positive F2 embryos. Scale bar, 100 μm. (E) Schematic overview of Lefty2 target KI and the germline transmission rate of linker-dendra2 precise integration at the Lefty2 locus. The nested PCR primers used for knock-in identification are shown (Supplementary Table S4). (F) Representative Southern blotting analysis of the Lefty2 targeted allele. T, KI target band. WT, wild type band. (G) Dendra2 fluorescence pattern in the Lefty2-linker-dendra2-V5 KI-positive F2 embryos. Scale bar, 100 μm. (H) Schematic overview of the strategy to generate a Bmp2b-linker-dendra2-V5-linker allele. The nested PCR primers used for knock-in identification are shown (Supplementary Table S4). (I) Germline transmission rate of linker-Dendra2 precise integration at the Bmp2b loci with different strategies. (J) Dendra2 fluorescence pattern in the Bmp2b-linker-Dendra2-V5-linker KI-positive F2 embryos. Scale bar, 100 μm. (K) Schematic overview of the strategy to generate the GFAP-5.5kb KI allele. The nested PCR primers used for knock-in identification are shown (Supplementary Table S4). (L) Germline transmission rate of 5.5 kb precise integration at the gfap locus.

Trans- or cis-dual nicks with RecOFAR facilitate more efficient and ‘clean’ genome editing in mice. (A) Schematic overview of the strategy to generate a Slc6a4-p2A-ChR2-EYFP KI allele. The nested PCR primers used for knock-in identification are shown (Supplementary Table S4). Two targets are shown with green. The restriction endonuclease used for Southern blotting is XbaI. A 3′ internal probe on 3′ homology arm is shown. (B) Germline transmission rate of p2A-ChR2-EYFP precise integration at the Slc6a4 locus with different strategies. (C) Southern blotting analysis of the Slc6a4 KI-targeted allele and WT mouse. T, KI target band. WT, wild type band. (D) Immunostaining brain sections of Slc6a4 KI F1 mice with anti-Serotonin (5-Hydroxytryptamine, 5-HT). ChR2-EYFP is in green and cells marked with anti-5HT are in red. DAPI in blue. Scale bar, 100 μm. (E) On-target indels analysis using Next-Gen-based multiplexed sequencing at the Slc6a4 locus with KI-positive alleles. The tails DNA from F0 generations were used and amplified with the on-target primers marked with different barcodes. Mock, control group with mock treatment. Comparisons between groups were analyzed with Student's t-test. ** indicates P < 0.01, **** indicates P < 0.0001. Error bars denote s.d. (F) Schematic overview of the strategy to generate a Myc-linker-sfGFP KI allele. The nested PCR primers used for knock-in identification are shown (Supplementary Table S4). (G) Germline transmission rate of linker-sfGFP precise integration at the Myc locus with and without RecOFAR. (H) Southern blotting analysis of the Myc targeted allele and WT mouse. T, KI target band. WT, wild type band.

Trans-dual nicks with RecOFAR facilitates efficient gene KI in rats. (A) Schematic overview of the strategy to generate a GFAP-p2A-mEYFP KI allele. The nested PCR primers used for knock-in identification are shown (Supplementary Table S4). Two targets are shown with green. The restriction endonuclease used for Southern blotting is SphI. A 3′ internal probe on 3′ homology arm is shown. (B) Germline transmission rate of p2A-mEYFP precise integration at the gfap locus without and with RecOFAR. (C) Immunostaining brain sections of gfap KI-positive F1 rats. Neurons marked with NeuN are in red, mEYFP is in green and glial cells marked with anti-GFAP are in white. Scale bar in left panel is 200 μm. The region in the box is magnified in the right panels. Scale bar, 100 μm. (D) Southern blotting analysis of the gfap targeted allele and WT. T, KI target band, 6.6 kb. (E) Schematic overview of the strategy to generate the Drd2-p2A-ChR2-EYFP, Drd1-p2A-ChR2-EYFP and Bassoon-5.5 kb KI alleles. The restriction endonuclease HindIII and KpnI were used for Southern blotting at the Drd2 and Drd1 loci respectively. Two 3′ internal probes on 3′ homology arms are shown at the Drd2 and Drd1 loci. The PCR primers used for knock-in identification are shown (Supplementary Table S4). (F) Germline transmission rate of p2A-ChR2-EYFP precise integration at the Drd2 locus with different strategies. (G) Southern blotting analysis of the Drd2-p2A-ChR2-EYFP targeted allele. (H) Western blotting analysis of Drd1 and Drd2 targeted allele in F1 generation. Brain tissues from Drd1-p2A-ChR2-EYFP and Drd2-p2A-ChR2-EYFP F1 homozygous were used as samples. (I) Immunostaining brain sections of Drd2 KI-positive F1 rats. EYFP is in green and cells marked with anti-Drd2 are in red. DAPI in blue. Scale bar, 10 μm. (J) Southern blotting analysis of the Drd1-p2A-ChR2-EYFP targeted allele and WT. T, KI target band, 5.0 kb. (K) Immunostaining brain sections of Drd1 KI-positive F1 rats. EYFP is in green and cells marked with anti-Drd1 are in red. DAPI in blue. Scale bar, 10 μm.

Trans-dual nicks with RecOFAR enable precise and efficient genome knock-in in monkey embryos. (A) Schematic overview of strategy to generate a CAMK2A-p2A- ChR2::EYFP knock-in allele. The nested PCR primers used for knock-in identification are shown (Supplementary Table S4). Two targets are shown with green. The offset distance between two targets is 49 bp. (B) Representative pictures of monkey embryos at distinct stages (Scale bar = 100 μm). The embryos at the morula/blastocyst stage were collected for genome extraction and analysis. (C) Successful HR of CAMK2A-p2A- ChR2::EYFP was confirmed by Sanger sequencing of the PCR amplicon. (D) Efficiencies of p2A-ChR2-EYFP precise integration at the CAMK2A locus and EGFP-p2A-NeoR-p2A precise integration at the Oct4 locus in monkey embryos. (E) Schematic overview of strategy to generate an EGFP-p2A-NeoR-p2A-Oct4 knock-in allele. The nested PCR primers used for knock-in identification are shown (Supplementary Table S4). Two targets are shown with green. The offset distance between two targets is 50 bp. (F) Successful HR of EGFP-p2A-NeoR-p2A-Oct4 was confirmed by Sanger sequencing of the PCR amplicon.

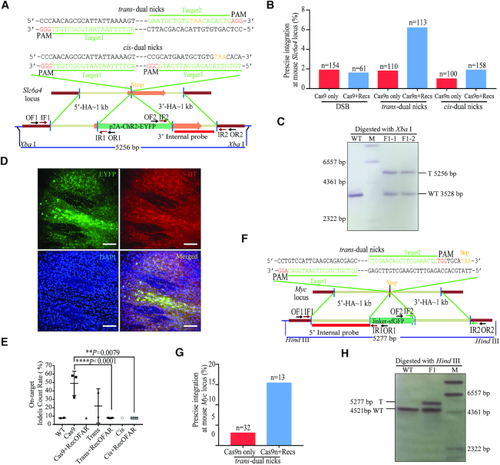
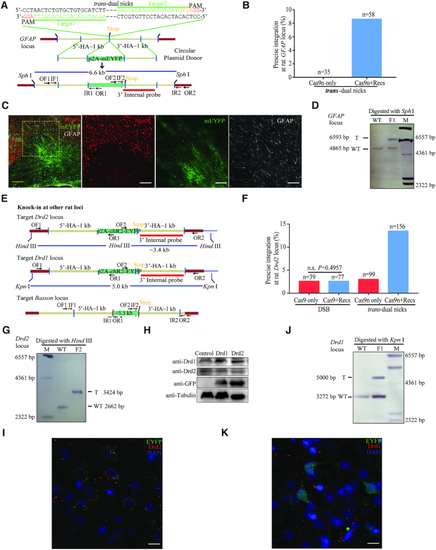
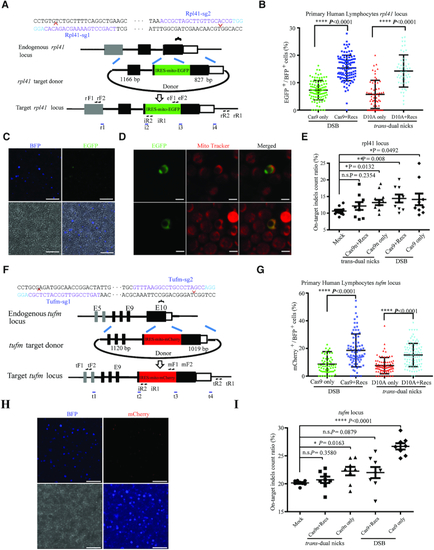
NEO achieved efficient integration in non-dividing primary human PBLCs. (A) Schematic overview of the strategy to generate the Rpl41-IRES-mito-EGFP cells. rF1, rF2, iR1, rR2, i2, i3, i4, eF1 and eF2 are the nest PCR primers (Supplementary Table S4). (B) Relative integration efficiencies (EGFP+ / BFP+) with IRES-mito-EGFP precise integration at the Rpl41 locus. Results were obtained from at least 2000 BFP+ cells and three independent electroporation experiments. The input data points calculated from each randomly selected image field were shown as dots. ****P < 0.0001, Student's t-test. (C) Mito-EGFP signals in the Rpl41-KI positive hPBLCs. Cells in blue were positively transfected with TagBFP that served as an indicator. Scale bar, 50 μm. (D) Live staining of hPBLCs with mito Tracker Red. Green, Rpl41-KI positive hPBLCs. MitoTracker Red fluorescence dye specifically labelled mitochondria in red. Scale bar, 5 μm. (E) On-target indel count ratio detected by IDAA at the Rpl41 locus. Total indel count ratio was calculated as the summed peak areas of all indel peaks relative to the total peak area. Results were obtained from at least three samples from independent electroporation experiments, each sample was tested three times. Mock, control group with mock treatment. n.s., no significant difference. *P < 0.05, **P < 0.01, Student's t-test. Error bars are s.d. (F) Schematic overview of the strategy to generate a TUFm-IRES-mito-mCherry KI cell. The nested PCR primers used for knock-in identification are shown (Supplementary Table S4). (G) Relative efficiencies of IRES-mito-mCherry precise integration at the TUFm locus. Results were obtained from at least 2000 BFP+ cells and three independent electroporation experiments. The input data points calculated from each randomly selected image field were shown as dots. ****P < 0.0001, Student's t-test. (H) Mito-mCherry signals in TUFm-KI positive hPBLCs. Cells in blue were positively transfected with TagBFP mRNA. Scale bar, 50 μm. (I) On-target indels count ratio detected by IDAA at the TUFm locus. Results were obtained from at least three samples from independent electroporation experiment, each sample was tested three times. Mock, control group with mock treatment. n.s., no significant difference, *P < 0.05, ****P < 0.0001, Student's t-test. Error bars denote s.d.

Acknowledgments
This image is the copyrighted work of the attributed author or publisher, and ZFIN has permission only to display this image to its users. Additional permissions should be obtained from the applicable author or publisher of the image. Full text @ Nucleic Acids Res.