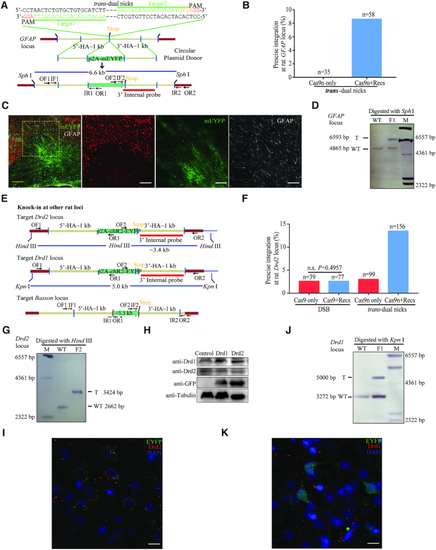
Trans-dual nicks with RecOFAR facilitates efficient gene KI in rats. (A) Schematic overview of the strategy to generate a GFAP-p2A-mEYFP KI allele. The nested PCR primers used for knock-in identification are shown (Supplementary Table S4). Two targets are shown with green. The restriction endonuclease used for Southern blotting is SphI. A 3′ internal probe on 3′ homology arm is shown. (B) Germline transmission rate of p2A-mEYFP precise integration at the gfap locus without and with RecOFAR. (C) Immunostaining brain sections of gfap KI-positive F1 rats. Neurons marked with NeuN are in red, mEYFP is in green and glial cells marked with anti-GFAP are in white. Scale bar in left panel is 200 μm. The region in the box is magnified in the right panels. Scale bar, 100 μm. (D) Southern blotting analysis of the gfap targeted allele and WT. T, KI target band, 6.6 kb. (E) Schematic overview of the strategy to generate the Drd2-p2A-ChR2-EYFP, Drd1-p2A-ChR2-EYFP and Bassoon-5.5 kb KI alleles. The restriction endonuclease HindIII and KpnI were used for Southern blotting at the Drd2 and Drd1 loci respectively. Two 3′ internal probes on 3′ homology arms are shown at the Drd2 and Drd1 loci. The PCR primers used for knock-in identification are shown (Supplementary Table S4). (F) Germline transmission rate of p2A-ChR2-EYFP precise integration at the Drd2 locus with different strategies. (G) Southern blotting analysis of the Drd2-p2A-ChR2-EYFP targeted allele. (H) Western blotting analysis of Drd1 and Drd2 targeted allele in F1 generation. Brain tissues from Drd1-p2A-ChR2-EYFP and Drd2-p2A-ChR2-EYFP F1 homozygous were used as samples. (I) Immunostaining brain sections of Drd2 KI-positive F1 rats. EYFP is in green and cells marked with anti-Drd2 are in red. DAPI in blue. Scale bar, 10 μm. (J) Southern blotting analysis of the Drd1-p2A-ChR2-EYFP targeted allele and WT. T, KI target band, 5.0 kb. (K) Immunostaining brain sections of Drd1 KI-positive F1 rats. EYFP is in green and cells marked with anti-Drd1 are in red. DAPI in blue. Scale bar, 10 μm.
|
